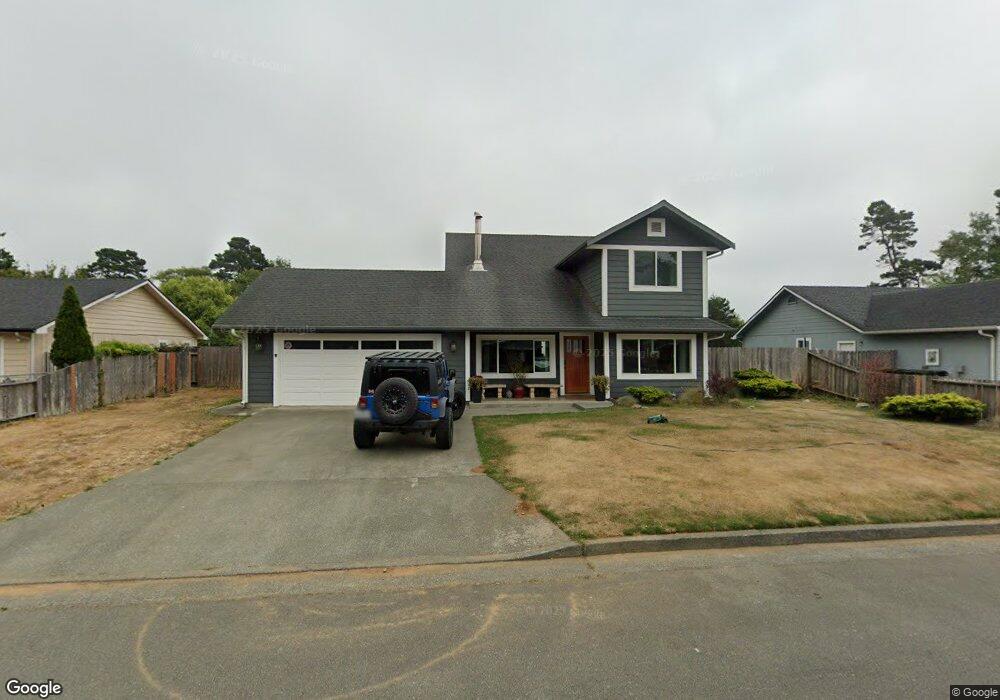
120 Victoria Ln Crescent City, CA 95531
Estimated Value: $351,000 - $414,000
3
Beds
2
Baths
1,602
Sq Ft
$237/Sq Ft
Est. Value
About This Home
This home is located at 120 Victoria Ln, Crescent City, CA 95531 and is currently estimated at $379,002, approximately $236 per square foot. 120 Victoria Ln is a home located in Del Norte County with nearby schools including Mary Peacock Elementary School, Crescent Elk Middle School, and Del Norte High School.
Ownership History
Date
Name
Owned For
Owner Type
Purchase Details
Closed on
Feb 20, 2009
Sold by
Wells Fargo Bank Na
Bought by
Eagles James W and Eagles Tory L
Current Estimated Value
Home Financials for this Owner
Home Financials are based on the most recent Mortgage that was taken out on this home.
Original Mortgage
$203,001
Interest Rate
4.99%
Mortgage Type
FHA
Purchase Details
Closed on
Aug 12, 2008
Sold by
Capon Eric J and Capon Cynthia D
Bought by
Wells Fargo Bank Na and Abfc 2005-Opt 1 Trust Abfc Asset Backed
Purchase Details
Closed on
Nov 6, 2003
Sold by
Honiker James P and Cook Cathleen J
Bought by
Capon Eric J and Capon Cynthia D
Home Financials for this Owner
Home Financials are based on the most recent Mortgage that was taken out on this home.
Original Mortgage
$153,000
Interest Rate
5.89%
Mortgage Type
Purchase Money Mortgage
Create a Home Valuation Report for This Property
The Home Valuation Report is an in-depth analysis detailing your home's value as well as a comparison with similar homes in the area
Home Values in the Area
Average Home Value in this Area
Purchase History
| Date | Buyer | Sale Price | Title Company |
|---|---|---|---|
| Eagles James W | $185,000 | Accommodation | |
| Wells Fargo Bank Na | $208,250 | Accommodation | |
| Capon Eric J | $170,000 | Crescent Land Title |
Source: Public Records
Mortgage History
| Date | Status | Borrower | Loan Amount |
|---|---|---|---|
| Previous Owner | Eagles James W | $203,001 | |
| Previous Owner | Capon Eric J | $153,000 |
Source: Public Records
Tax History Compared to Growth
Tax History
| Year | Tax Paid | Tax Assessment Tax Assessment Total Assessment is a certain percentage of the fair market value that is determined by local assessors to be the total taxable value of land and additions on the property. | Land | Improvement |
|---|---|---|---|---|
| 2025 | $2,602 | $238,221 | $109,452 | $128,769 |
| 2024 | $2,602 | $233,551 | $107,306 | $126,245 |
| 2023 | $2,487 | $228,972 | $105,202 | $123,770 |
| 2022 | $2,436 | $224,484 | $103,140 | $121,344 |
| 2021 | $2,420 | $220,083 | $101,118 | $118,965 |
| 2020 | $2,549 | $217,828 | $100,082 | $117,746 |
| 2019 | $2,310 | $213,558 | $98,120 | $115,438 |
| 2018 | $2,043 | $176,039 | $62,131 | $113,908 |
| 2017 | $2,020 | $179,559 | $63,373 | $116,186 |
| 2016 | $2,020 | $176,039 | $62,131 | $113,908 |
| 2015 | $1,986 | $173,395 | $61,198 | $112,197 |
| 2014 | $1,960 | $141,639 | $60,272 | $81,367 |
Source: Public Records
Map
Nearby Homes
- 1718 Northcrest Dr
- 188 E Madison Ave
- 0 E Adams Ave
- 1725 Northcrest Dr
- 1760 Amador St
- 115 Georgetown Place
- 1811 Northcrest Dr
- 275 Chevy Chase Way
- 1745 Potomac Ct
- 1661 Northcrest Dr Unit Space 96
- 1950 Northcrest Dr
- 125 W Washington Blvd
- 1775 Northcrest Dr
- 0000 E Washington Blvd
- 95 Dell Ln
- 00 Adams Ave
- 120 W Coolidge Ave
- 525 Leif Cir
- 160 Leif Cir
- 650 E Washington Blvd
- 130 Victoria Ln
- 110 Victoria Ln
- 125 Victoria Ln Unit Off Madison
- 140 Victoria Ln
- 135 Victoria Ln Unit Off Madison
- 355 E Madison Ave
- 335 E Madison Ave
- 145 Victoria Ln
- 150 Victoria Ln
- 219 E Madison Ave
- 221 E Madison Ave Unit Northcrest Drive
- 221 E Madison Ave
- 155 Victoria Ln
- 53 Victoria Ln
- 52 Victoria Ln
- 0 E Madison Ave
- 160 Victoria Ln
- 155 E Madison Ave
- 300 Arnett St
- 1740 Northcrest Dr