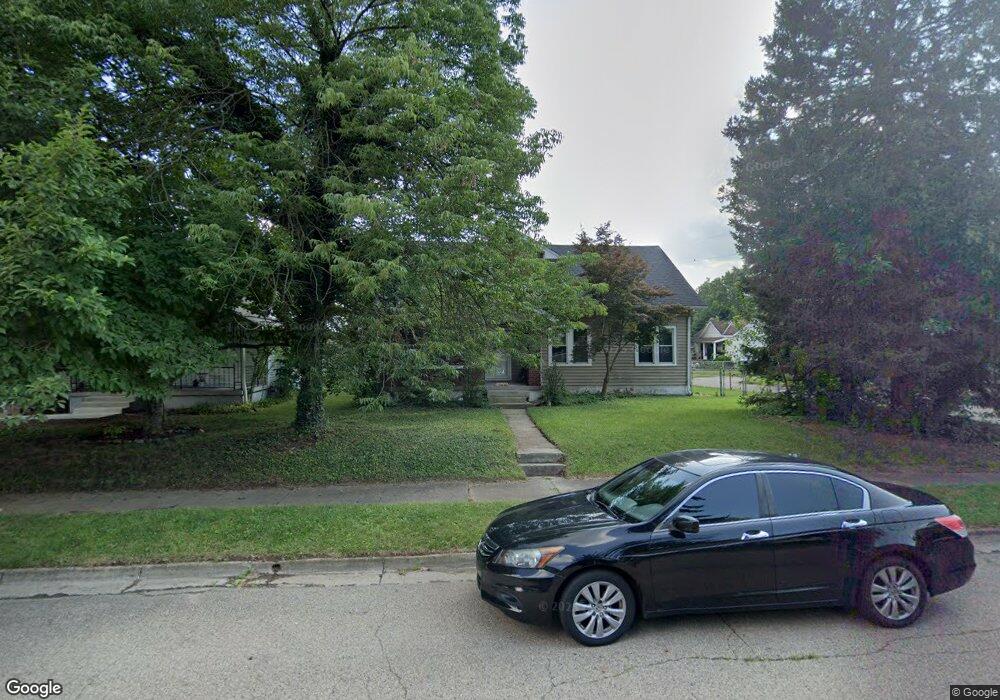
120 W Bryant Ave Franklin, OH 45005
Estimated Value: $188,000 - $236,000
3
Beds
1
Bath
1,576
Sq Ft
$130/Sq Ft
Est. Value
About This Home
This home is located at 120 W Bryant Ave, Franklin, OH 45005 and is currently estimated at $205,314, approximately $130 per square foot. 120 W Bryant Ave is a home located in Warren County with nearby schools including Franklin High School.
Ownership History
Date
Name
Owned For
Owner Type
Purchase Details
Closed on
Aug 31, 2009
Sold by
Shannon Larry and Shannon Deborah
Bought by
Davis Melissa L
Current Estimated Value
Home Financials for this Owner
Home Financials are based on the most recent Mortgage that was taken out on this home.
Original Mortgage
$96,224
Outstanding Balance
$61,931
Interest Rate
5.28%
Mortgage Type
FHA
Estimated Equity
$143,383
Purchase Details
Closed on
Apr 24, 2006
Sold by
Hud
Bought by
Shannon Larry and Shannon Deborah
Purchase Details
Closed on
Jan 17, 2006
Sold by
Union Savings Bank
Bought by
Hud
Purchase Details
Closed on
Dec 28, 2005
Sold by
Robinson Jeffrey S and Case #05Cv63734
Bought by
Union Savings Bank
Purchase Details
Closed on
Sep 16, 2002
Sold by
Dick Erma
Bought by
Robinson Jeffery S
Home Financials for this Owner
Home Financials are based on the most recent Mortgage that was taken out on this home.
Original Mortgage
$84,233
Interest Rate
6.54%
Mortgage Type
FHA
Purchase Details
Closed on
Nov 20, 1990
Sold by
Dick & Norman S Sr & Erm and Dick Norman S
Bought by
Dick Dick and Dick Erma J
Create a Home Valuation Report for This Property
The Home Valuation Report is an in-depth analysis detailing your home's value as well as a comparison with similar homes in the area
Home Values in the Area
Average Home Value in this Area
Purchase History
| Date | Buyer | Sale Price | Title Company |
|---|---|---|---|
| Davis Melissa L | $98,000 | Hallmark Title Agency Inc | |
| Shannon Larry | $60,101 | Lakeside Title | |
| Hud | -- | None Available | |
| Union Savings Bank | $63,334 | None Available | |
| Robinson Jeffery S | $84,900 | -- | |
| Dick Dick | -- | -- |
Source: Public Records
Mortgage History
| Date | Status | Borrower | Loan Amount |
|---|---|---|---|
| Open | Davis Melissa L | $96,224 | |
| Previous Owner | Robinson Jeffery S | $84,233 |
Source: Public Records
Tax History
| Year | Tax Paid | Tax Assessment Tax Assessment Total Assessment is a certain percentage of the fair market value that is determined by local assessors to be the total taxable value of land and additions on the property. | Land | Improvement |
|---|---|---|---|---|
| 2025 | $2,889 | $52,500 | $10,010 | $42,490 |
| 2024 | $2,889 | $52,500 | $10,010 | $42,490 |
| 2023 | $2,331 | $40,421 | $5,677 | $34,744 |
| 2022 | $2,290 | $40,422 | $5,677 | $34,745 |
| 2021 | $2,183 | $40,422 | $5,677 | $34,745 |
| 2020 | $1,985 | $32,081 | $4,505 | $27,577 |
| 2019 | $1,825 | $32,081 | $4,505 | $27,577 |
| 2018 | $1,592 | $32,081 | $4,505 | $27,577 |
| 2017 | $1,890 | $30,499 | $4,326 | $26,173 |
| 2016 | $1,923 | $30,499 | $4,326 | $26,173 |
| 2015 | $1,923 | $30,499 | $4,326 | $26,173 |
| 2014 | $1,967 | $30,500 | $4,330 | $26,170 |
| 2013 | $1,489 | $35,290 | $5,010 | $30,280 |
Source: Public Records
Map
Nearby Homes
- 228 Bridge St
- 0 Victoria Dr Unit 942075
- 0 Victoria Dr Unit 1852824
- 5 S River St
- 413 Spring Ave
- 210 N Riley Blvd
- 605 Spring Ave
- 205 Oxford Rd
- 410 Park Ave
- 616 Lake Ave
- 202 E 2nd St
- 551 E 2nd St
- 509 Forest Ave
- 33 Stadia Dr
- 511 Forest Ave
- 309 Oxford Rd
- 657 E 2nd St
- 651 E 2nd St
- 730 Park Ave
- 712 Abney Ln
- 118 W Bryant Ave
- 114 W Bryant Ave
- 232 Bridge St
- 112 W Bryant Ave
- 321 Bridge St
- 317 Bridge St
- 325 Bridge St
- 315 Bridge St
- 125 W Bryant Ave
- 110 W Bryant Ave
- 129 W Bryant Ave
- 123 W Bryant Ave
- 401 Bridge St
- 121 W Bryant Ave
- 212 Bridge St Unit B
- 212 Bridge St Unit E
- 309 Bridge St
- 405 Bridge St
- 108 W Bryant Ave
- 119 W Bryant Ave
Your Personal Tour Guide
Ask me questions while you tour the home.