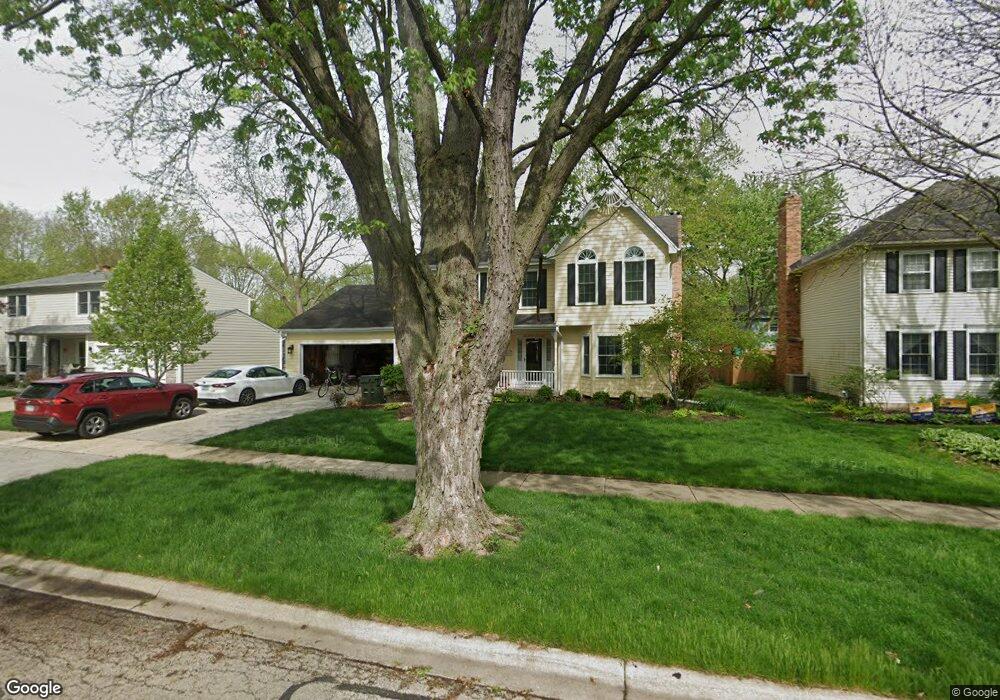
1200 Piccadilly Cir Naperville, IL 60563
Brookdale NeighborhoodEstimated Value: $597,000 - $636,000
4
Beds
3
Baths
2,451
Sq Ft
$254/Sq Ft
Est. Value
About This Home
This home is located at 1200 Piccadilly Cir, Naperville, IL 60563 and is currently estimated at $621,395, approximately $253 per square foot. 1200 Piccadilly Cir is a home located in DuPage County with nearby schools including Brookdale Elementary School, Thayer J. Hill Middle School, and Metea Valley High School.
Ownership History
Date
Name
Owned For
Owner Type
Purchase Details
Closed on
Feb 1, 2017
Sold by
Babler Thomas E and Babler Mary J
Bought by
Babler Thomas E and Babler Mary J
Current Estimated Value
Purchase Details
Closed on
Apr 28, 2005
Sold by
Hewitt Relocation Services Inc
Bought by
Babler Thomas E and Babler Mary J
Home Financials for this Owner
Home Financials are based on the most recent Mortgage that was taken out on this home.
Original Mortgage
$300,720
Interest Rate
5.91%
Mortgage Type
New Conventional
Purchase Details
Closed on
Apr 12, 2005
Sold by
Miller Michael L and Miller Pamela L
Bought by
Hewitt Relocation Services Inc
Home Financials for this Owner
Home Financials are based on the most recent Mortgage that was taken out on this home.
Original Mortgage
$300,720
Interest Rate
5.91%
Mortgage Type
New Conventional
Create a Home Valuation Report for This Property
The Home Valuation Report is an in-depth analysis detailing your home's value as well as a comparison with similar homes in the area
Home Values in the Area
Average Home Value in this Area
Purchase History
| Date | Buyer | Sale Price | Title Company |
|---|---|---|---|
| Babler Thomas E | -- | Attorney | |
| Babler Thomas E | $376,000 | Amerititle Inc | |
| Hewitt Relocation Services Inc | $376,000 | Old Republic Title Company |
Source: Public Records
Mortgage History
| Date | Status | Borrower | Loan Amount |
|---|---|---|---|
| Previous Owner | Babler Thomas E | $300,720 | |
| Closed | Babler Thomas E | $37,590 |
Source: Public Records
Tax History
| Year | Tax Paid | Tax Assessment Tax Assessment Total Assessment is a certain percentage of the fair market value that is determined by local assessors to be the total taxable value of land and additions on the property. | Land | Improvement |
|---|---|---|---|---|
| 2024 | $11,117 | $186,099 | $49,624 | $136,475 |
| 2023 | $10,646 | $167,220 | $44,590 | $122,630 |
| 2022 | $10,242 | $155,860 | $41,210 | $114,650 |
| 2021 | $9,919 | $150,300 | $39,740 | $110,560 |
| 2020 | $9,905 | $150,300 | $39,740 | $110,560 |
| 2019 | $9,515 | $142,950 | $37,800 | $105,150 |
| 2018 | $9,514 | $140,410 | $36,830 | $103,580 |
| 2017 | $9,168 | $135,650 | $35,580 | $100,070 |
| 2016 | $9,001 | $130,190 | $34,150 | $96,040 |
| 2015 | $8,917 | $123,610 | $32,420 | $91,190 |
| 2014 | $8,738 | $117,330 | $30,530 | $86,800 |
| 2013 | $8,719 | $117,040 | $30,740 | $86,300 |
Source: Public Records
Map
Nearby Homes
- 1106 Langley Cir
- 1607 Albermarle Ct
- 1008 Churchill Dr
- 1887 Paddington Ave Unit 3
- 936 Moultrie Ct
- 844 Donelson Ct Unit 271704
- 911 Sheridan Cir Unit 210505
- 1345 Queensgreen Cir Unit 1401
- 1565 Raymond Dr Unit 101
- 1535 Raymond Dr Unit 202
- 5S530 Scots Dr Unit 18G
- 5S530 Paxton Dr Unit 1B
- 2805 Bond Cir
- 1706 Windward Ave Unit 75
- 1710 Windward Ave Unit 77
- 1022 Neudearborn Ln Unit 19-1022
- 724 Small Ct
- 5S022 Raymond Dr
- 2040 Iron Ridge Ln
- 2044 Iron Ridge Ln
- 1132 Piccadilly Cir
- 1204 Piccadilly Cir
- 1031 Langley Cir
- 1027 Langley Cir
- 1128 Piccadilly Cir
- 1101 Langley Cir
- 1208 Piccadilly Cir
- 1201 Piccadilly Cir
- 1209 Piccadilly Cir
- 1023 Langley Cir
- 1124 Piccadilly Cir
- 1105 Langley Cir
- 1700 Prince Ct
- 1212 Piccadilly Cir
- 1019 Langley Cir
- 1028 Langley Cir
- 1217 Piccadilly Cir
- 1120 Piccadilly Cir
- 1705 Prince Ct
- 1034 Langley Cir
Your Personal Tour Guide
Ask me questions while you tour the home.