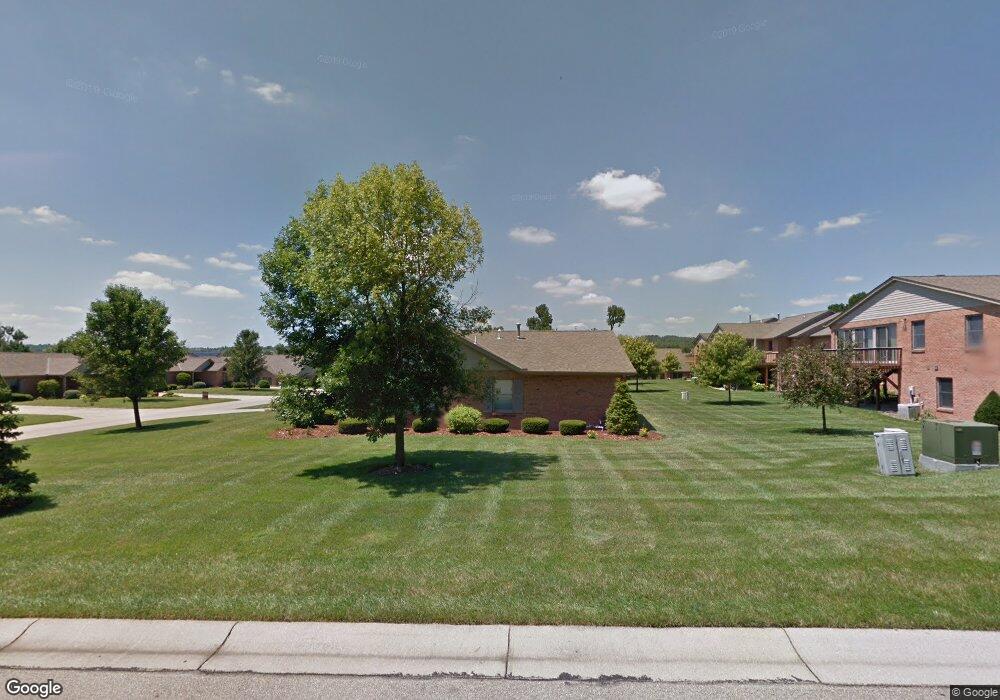
1200 Stephanie Dr Unit 16 Hamilton, OH 45013
Estimated Value: $311,229 - $336,000
2
Beds
2
Baths
1,824
Sq Ft
$178/Sq Ft
Est. Value
About This Home
This home is located at 1200 Stephanie Dr Unit 16, Hamilton, OH 45013 and is currently estimated at $323,807, approximately $177 per square foot. 1200 Stephanie Dr Unit 16 is a home located in Butler County with nearby schools including Brookwood Elementary School, Wilson Middle School, and Hamilton High School Main Campus.
Ownership History
Date
Name
Owned For
Owner Type
Purchase Details
Closed on
Nov 26, 2018
Sold by
Bagley Ronald L and Bagley Daniel S
Bought by
Hornsby Paul R and Hornsby Barbara A
Current Estimated Value
Purchase Details
Closed on
Nov 3, 2016
Sold by
Peacher Judith A
Bought by
Bagley Ronald L and Bagley Maroia R
Purchase Details
Closed on
Aug 10, 2015
Sold by
Raisor Crystal L
Bought by
Peacher Judith A
Purchase Details
Closed on
Feb 18, 2008
Sold by
Brooks Randy W
Bought by
Perry Donald G and Perry Martha J
Purchase Details
Closed on
May 27, 2004
Sold by
Marsh James
Bought by
Brooks Dorothy L
Purchase Details
Closed on
Dec 9, 1997
Sold by
Steven Wittman Const Inc
Bought by
James Marsh Trustee
Purchase Details
Closed on
Nov 10, 1997
Sold by
Steve Wittman Const Inc
Bought by
Preston Charles R and Preston Laverne M
Create a Home Valuation Report for This Property
The Home Valuation Report is an in-depth analysis detailing your home's value as well as a comparison with similar homes in the area
Home Values in the Area
Average Home Value in this Area
Purchase History
| Date | Buyer | Sale Price | Title Company |
|---|---|---|---|
| Hornsby Paul R | $200,000 | None Available | |
| Bagley Ronald L | $162,000 | None Available | |
| Peacher Judith A | $155,000 | Attorney | |
| Perry Donald G | $167,000 | Attorney | |
| Brooks Dorothy L | $773,000 | -- | |
| James Marsh Trustee | $163,149 | -- | |
| Preston Charles R | $141,400 | -- |
Source: Public Records
Tax History Compared to Growth
Tax History
| Year | Tax Paid | Tax Assessment Tax Assessment Total Assessment is a certain percentage of the fair market value that is determined by local assessors to be the total taxable value of land and additions on the property. | Land | Improvement |
|---|---|---|---|---|
| 2024 | $3,110 | $83,200 | $10,500 | $72,700 |
| 2023 | $3,109 | $83,200 | $10,500 | $72,700 |
| 2022 | $2,683 | $65,570 | $10,500 | $55,070 |
| 2021 | $2,468 | $63,250 | $10,500 | $52,750 |
| 2020 | $2,571 | $63,250 | $10,500 | $52,750 |
| 2019 | $3,906 | $53,350 | $10,500 | $42,850 |
| 2018 | $2,551 | $53,350 | $10,500 | $42,850 |
| 2017 | $2,572 | $53,350 | $10,500 | $42,850 |
| 2016 | $2,509 | $51,010 | $10,500 | $40,510 |
| 2015 | $2,567 | $51,010 | $10,500 | $40,510 |
| 2014 | $2,284 | $58,450 | $14,000 | $44,450 |
| 2013 | $2,284 | $58,450 | $14,000 | $44,450 |
Source: Public Records
Map
Nearby Homes
- 1210 Stephanie Dr
- 1210 Stephanie Dr Unit 3
- 1190 Stephanie Dr
- 1230 Stephanie Dr
- 5 Waterview Ct Unit 30
- 71 Livingston Dr
- 75 Waterpoint Ln
- 55 Cove Ct
- 1331 Peregrine Way
- 4 Peregrine Way
- 1415 Main St
- 1038 Golden Oak Dr
- 850 NW Washington Blvd
- 1956 Redbud Dr
- 748 Beeler Blvd
- 1908 Gardner Rd
- 14 Justin Place
- 742 Miami Way Dr
- 1421 Helma Ave
- 720 Shultz Dr
- 1200 Stephanie Dr
- 1200 Stephanie Dr Unit 18
- 1200 Stephanie Dr Unit 5
- 1200 Stephanie Dr Unit 4
- 1200 Stephanie Dr Unit 6
- 1202 Deerfield Cir
- 1210 Stephanie Dr Unit 20
- 1210 Stephanie Dr Unit 21
- 1212 Deerfield Cir
- 1190 Stephanie Dr
- 1190 Stephanie Dr Unit 13
- 1190 Stephanie Dr Unit 3
- 1190 Stephanie Dr Unit 2
- 1222 Deerfield Cir
- 1192 Deerfield Cir Unit 35
- 1220 Stephanie Dr
- 1220 Stephanie Dr
- 1220 Stephanie Dr
- 1220 Stephanie Dr Unit 4
- 1220 Stephanie Dr Unit 6