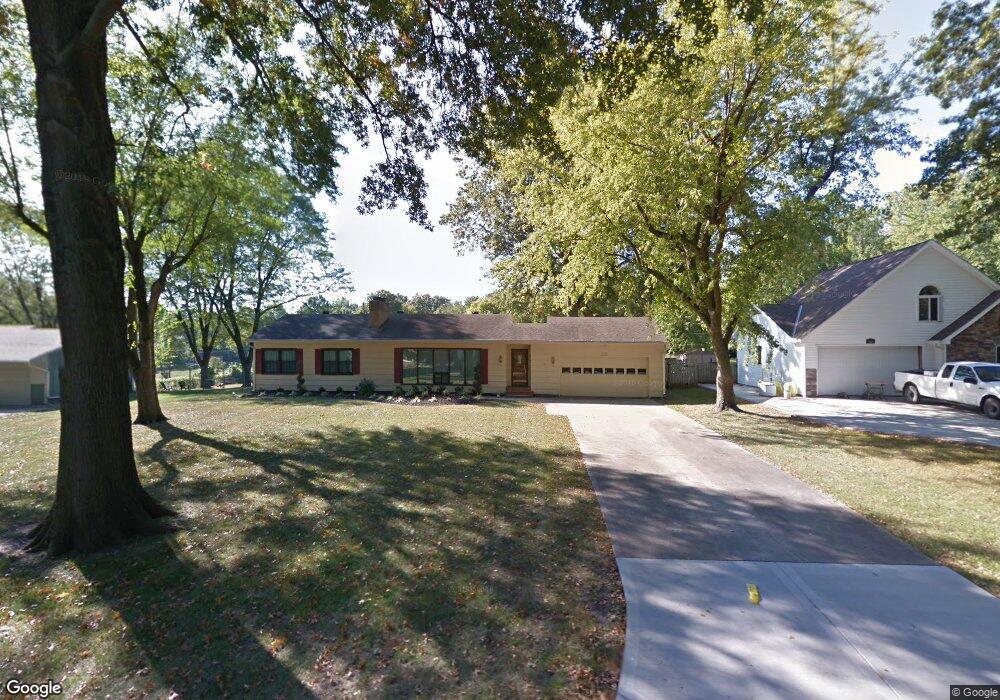
1201 E 108th St Kansas City, MO 64131
Red Bridge North NeighborhoodEstimated Value: $324,000 - $400,000
2
Beds
2
Baths
2,073
Sq Ft
$171/Sq Ft
Est. Value
About This Home
This home is located at 1201 E 108th St, Kansas City, MO 64131 and is currently estimated at $353,570, approximately $170 per square foot. 1201 E 108th St is a home located in Jackson County with nearby schools including Red Bridge Elementary School, Center Middle School, and Center High School.
Ownership History
Date
Name
Owned For
Owner Type
Purchase Details
Closed on
Jun 6, 2024
Sold by
Design Massage Therapy Llc
Bought by
Crown City Homes Llc
Current Estimated Value
Home Financials for this Owner
Home Financials are based on the most recent Mortgage that was taken out on this home.
Original Mortgage
$151,000
Outstanding Balance
$149,128
Interest Rate
7.17%
Mortgage Type
Credit Line Revolving
Estimated Equity
$204,442
Purchase Details
Closed on
Jul 21, 2017
Sold by
Bennett Dana K
Bought by
Design Massage Therapy Llc
Home Financials for this Owner
Home Financials are based on the most recent Mortgage that was taken out on this home.
Original Mortgage
$87,750
Interest Rate
3.91%
Mortgage Type
Commercial
Purchase Details
Closed on
Mar 31, 2015
Sold by
Bennett Dana K
Bought by
Bennett Dana K
Create a Home Valuation Report for This Property
The Home Valuation Report is an in-depth analysis detailing your home's value as well as a comparison with similar homes in the area
Home Values in the Area
Average Home Value in this Area
Purchase History
| Date | Buyer | Sale Price | Title Company |
|---|---|---|---|
| Crown City Homes Llc | -- | Secured Title | |
| Design Massage Therapy Llc | -- | Alpha Title | |
| Bennett Dana K | -- | None Available | |
| Bennett Dana K | -- | None Available |
Source: Public Records
Mortgage History
| Date | Status | Borrower | Loan Amount |
|---|---|---|---|
| Open | Crown City Homes Llc | $151,000 | |
| Previous Owner | Design Massage Therapy Llc | $87,750 |
Source: Public Records
Tax History Compared to Growth
Tax History
| Year | Tax Paid | Tax Assessment Tax Assessment Total Assessment is a certain percentage of the fair market value that is determined by local assessors to be the total taxable value of land and additions on the property. | Land | Improvement |
|---|---|---|---|---|
| 2025 | $3,078 | $36,937 | $9,491 | $27,446 |
| 2024 | $3,078 | $39,868 | $5,858 | $34,010 |
| 2023 | $3,016 | $49,368 | $4,822 | $44,546 |
| 2022 | $2,435 | $27,930 | $5,520 | $22,410 |
| 2021 | $2,427 | $27,930 | $5,520 | $22,410 |
| 2020 | $2,592 | $27,885 | $5,520 | $22,365 |
| 2019 | $2,344 | $27,885 | $5,520 | $22,365 |
| 2018 | $2,432 | $25,757 | $6,027 | $19,730 |
| 2017 | $2,423 | $25,757 | $6,027 | $19,730 |
| 2016 | $2,423 | $25,111 | $5,128 | $19,983 |
| 2014 | $2,403 | $24,619 | $5,027 | $19,592 |
Source: Public Records
Map
Nearby Homes
- 1309 E 108th St
- 10925 Harrison St
- 701 E 109th St
- 618 E 108th Terrace
- 619 E 109th St
- 712 E 110th Terrace
- 1208 E Red Bridge Rd
- 600 E 106th Terrace
- 619 E 109th Terrace
- 12823 Kenwood Ave
- 12819 Kenwood Ave
- 12827 Kenwood Ave
- 12831 Kenwood Ave
- 11020 Charlotte St
- 10729 McGee St
- 10218 Tracy Ave
- 257 E Bridlespur Dr
- 10110 Forest Ave
- 101 E 109th Terrace
- 11100 McGee St
- 1109 E 108th St
- 1105 E 108th St
- 1200 E 108th St
- 1108 E 108th St
- 1205 E 108th St
- 1204 E 108th St
- 1104 E 108th St
- 1101 E 108th St
- 1211 E 108th St
- 1100 E 108th St
- 1208 E 108th St
- 1301 E 108th St
- 1300 E 108th St
- 1011 E 108th St
- 1008 E 108th St
- 1000 E 108th Terrace
- 1200 E 108th Terrace
- 1305 E 108th St
- 1304 E 108th St
- 1108 E 108th Terrace