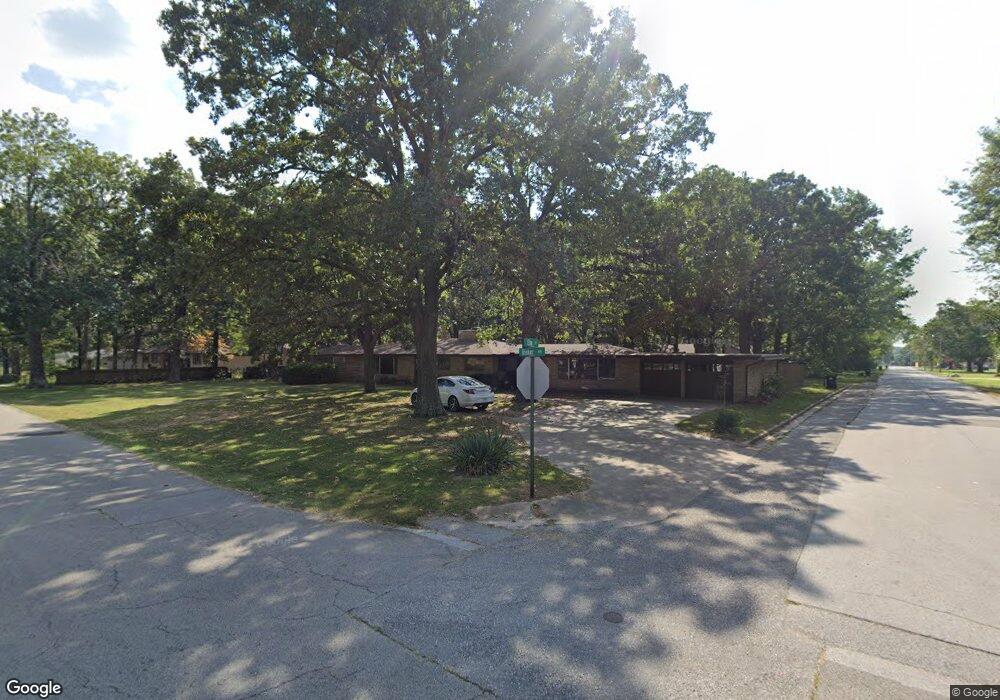
1201 S Rinker Ave Aurora, MO 65605
Estimated Value: $229,000 - $305,000
3
Beds
2
Baths
3,298
Sq Ft
$83/Sq Ft
Est. Value
About This Home
This home is located at 1201 S Rinker Ave, Aurora, MO 65605 and is currently estimated at $272,622, approximately $82 per square foot. 1201 S Rinker Ave is a home located in Lawrence County with nearby schools including Pate Early Childhood Center, Robinson Elementary School, and Robinson Intermediate School.
Ownership History
Date
Name
Owned For
Owner Type
Purchase Details
Closed on
Sep 13, 2021
Sold by
Kennedy Anthony and Kennedy Tony R
Bought by
Kennedy Anthony and Kennedy Alisha
Current Estimated Value
Home Financials for this Owner
Home Financials are based on the most recent Mortgage that was taken out on this home.
Original Mortgage
$120,000
Outstanding Balance
$107,994
Interest Rate
2.8%
Mortgage Type
New Conventional
Estimated Equity
$164,628
Purchase Details
Closed on
Mar 30, 2011
Sold by
Crouch Charles O and Crouch Charles D
Bought by
Kennedy Tony R
Home Financials for this Owner
Home Financials are based on the most recent Mortgage that was taken out on this home.
Original Mortgage
$75,525
Interest Rate
5.04%
Purchase Details
Closed on
Jan 18, 2008
Sold by
Seifried David A and Seifried Diana C
Bought by
Crouch Charles O and Crouch Charles D
Home Financials for this Owner
Home Financials are based on the most recent Mortgage that was taken out on this home.
Original Mortgage
$72,500
Interest Rate
6.11%
Mortgage Type
Seller Take Back
Create a Home Valuation Report for This Property
The Home Valuation Report is an in-depth analysis detailing your home's value as well as a comparison with similar homes in the area
Home Values in the Area
Average Home Value in this Area
Purchase History
| Date | Buyer | Sale Price | Title Company |
|---|---|---|---|
| Kennedy Anthony | -- | Accommodation | |
| Kennedy Tony R | -- | -- | |
| Kennedy Tony R | -- | None Available | |
| Crouch Charles O | -- | None Available |
Source: Public Records
Mortgage History
| Date | Status | Borrower | Loan Amount |
|---|---|---|---|
| Open | Kennedy Anthony | $120,000 | |
| Closed | Kennedy Tony R | $75,525 | |
| Previous Owner | Crouch Charles O | $72,500 |
Source: Public Records
Tax History
| Year | Tax Paid | Tax Assessment Tax Assessment Total Assessment is a certain percentage of the fair market value that is determined by local assessors to be the total taxable value of land and additions on the property. | Land | Improvement |
|---|---|---|---|---|
| 2025 | $1,419 | $28,350 | $2,850 | $25,500 |
| 2024 | $1,303 | $25,840 | $2,850 | $22,990 |
| 2023 | $1,296 | $25,840 | $2,850 | $22,990 |
| 2022 | $1,212 | $24,170 | $2,850 | $21,320 |
| 2021 | $1,213 | $24,170 | $2,850 | $21,320 |
| 2020 | $1,177 | $23,220 | $1,900 | $21,320 |
| 2019 | $1,157 | $23,220 | $1,900 | $21,320 |
| 2018 | $1,155 | $23,220 | $1,900 | $21,320 |
| 2017 | $1,149 | $23,220 | $1,900 | $21,320 |
| 2016 | -- | $21,130 | $1,900 | $19,230 |
| 2015 | -- | $21,130 | $1,900 | $19,230 |
| 2014 | -- | $21,130 | $1,900 | $19,230 |
Source: Public Records
Map
Nearby Homes
- 905 S Griffith Ave
- 516 E Springfield St
- 723 E Walnut St
- 116 E Hadley St
- 000 E Glendale St
- 825 S Park Ave
- 1015 Mcphail Ave
- 1305 S Jefferson Ave
- 808 E Walnut St
- 806 E Springfield St
- 1622 S Porter Ave
- 601 E Highland St
- 317 E Highland St
- 33 W Street Louis St
- 537 S Jefferson Ave
- 23 W Anderson St
- 114 E College St
- 220 W Springfield St Unit Package
- 312 S Oak Ave
- 224 W Springfield St
- 1207 S Rinker Ave
- 403 E Elm St
- 1109 S Rinker Ave
- 400 E Elm St
- 1202 S Rinker Ave
- 1204 S Rinker Ave
- 1114 S Rinker Ave
- 1204 S Oak Ave
- 1107 S Rinker Ave
- 1215 S Rinker Ave
- 1214 S Oak Ave
- 1112 S Rinker Ave
- 499 E Hadley St
- 1110 S Rinker Ave
- 501 E Hadley St
- 501 E Hadley St Unit 60001637
- 401 E Hadley St
- 1108 S Rinker Ave
- 1201 S Oak Ave
- 410 E Plumb St
Your Personal Tour Guide
Ask me questions while you tour the home.