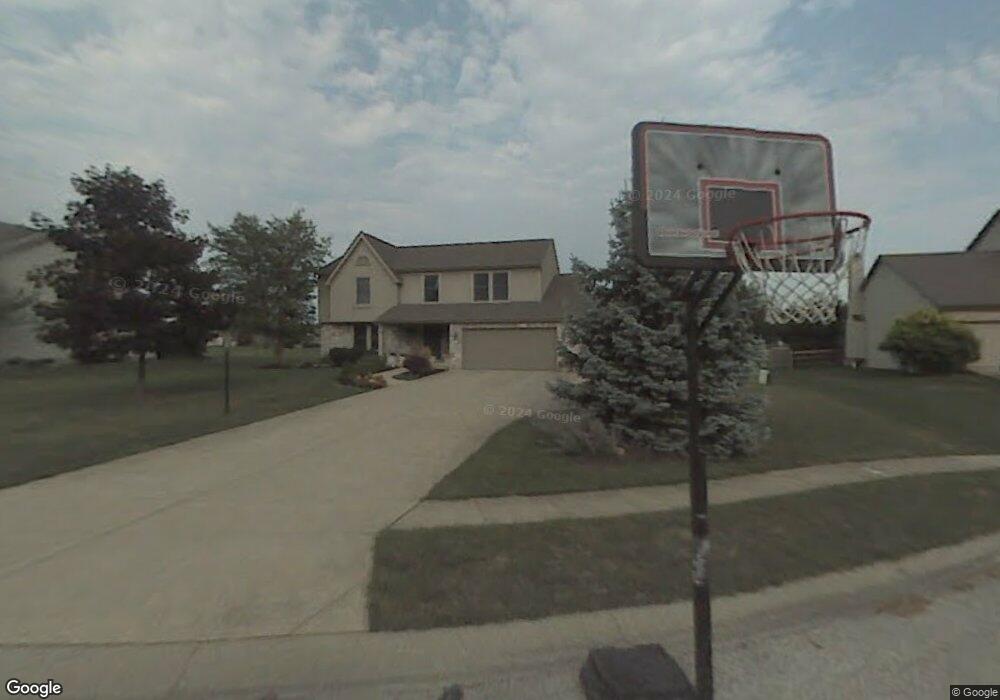
12014 Sheldrake Ct Pickerington, OH 43147
Estimated Value: $495,115 - $552,000
4
Beds
4
Baths
3,253
Sq Ft
$160/Sq Ft
Est. Value
About This Home
This home is located at 12014 Sheldrake Ct, Pickerington, OH 43147 and is currently estimated at $519,279, approximately $159 per square foot. 12014 Sheldrake Ct is a home located in Fairfield County with nearby schools including Violet Elementary School, Harmon Middle School, and Pickerington Lakeview Junior High School.
Ownership History
Date
Name
Owned For
Owner Type
Purchase Details
Closed on
Dec 20, 2010
Sold by
Feeney Steven and Feeney Susan L
Bought by
Dennett James M and Dennett Michelle R
Current Estimated Value
Home Financials for this Owner
Home Financials are based on the most recent Mortgage that was taken out on this home.
Original Mortgage
$193,600
Outstanding Balance
$127,517
Interest Rate
4.16%
Mortgage Type
New Conventional
Estimated Equity
$391,762
Purchase Details
Closed on
Oct 9, 1996
Sold by
Cegelski Thomas
Bought by
Feeney Steven and Feeney Susan L
Home Financials for this Owner
Home Financials are based on the most recent Mortgage that was taken out on this home.
Original Mortgage
$198,900
Interest Rate
8.14%
Mortgage Type
New Conventional
Purchase Details
Closed on
Aug 31, 1992
Bought by
Gemstar Homes Inc
Purchase Details
Closed on
Mar 25, 1992
Bought by
Gemstar Homes Inc
Purchase Details
Closed on
Aug 1, 1990
Create a Home Valuation Report for This Property
The Home Valuation Report is an in-depth analysis detailing your home's value as well as a comparison with similar homes in the area
Home Values in the Area
Average Home Value in this Area
Purchase History
| Date | Buyer | Sale Price | Title Company |
|---|---|---|---|
| Dennett James M | $242,000 | Arrow Title Agency Llc | |
| Feeney Steven | $221,000 | -- | |
| Gemstar Homes Inc | $185,000 | -- | |
| Gemstar Homes Inc | $31,600 | -- | |
| -- | $543,700 | -- |
Source: Public Records
Mortgage History
| Date | Status | Borrower | Loan Amount |
|---|---|---|---|
| Open | Dennett James M | $193,600 | |
| Closed | Feeney Steven | $198,900 |
Source: Public Records
Tax History Compared to Growth
Tax History
| Year | Tax Paid | Tax Assessment Tax Assessment Total Assessment is a certain percentage of the fair market value that is determined by local assessors to be the total taxable value of land and additions on the property. | Land | Improvement |
|---|---|---|---|---|
| 2024 | $14,658 | $123,700 | $21,890 | $101,810 |
| 2023 | $5,628 | $123,700 | $21,890 | $101,810 |
| 2022 | $5,645 | $123,700 | $21,890 | $101,810 |
| 2021 | $5,063 | $94,510 | $19,100 | $75,410 |
| 2020 | $5,119 | $94,510 | $19,100 | $75,410 |
| 2019 | $5,151 | $94,510 | $19,100 | $75,410 |
| 2018 | $5,343 | $81,660 | $19,100 | $62,560 |
| 2017 | $5,350 | $85,620 | $19,100 | $66,520 |
| 2016 | $5,320 | $85,620 | $19,100 | $66,520 |
| 2015 | $5,301 | $82,670 | $19,100 | $63,570 |
| 2014 | $5,232 | $82,670 | $19,100 | $63,570 |
| 2013 | $5,232 | $82,670 | $19,100 | $63,570 |
Source: Public Records
Map
Nearby Homes
- 12008 Sheldrake Ct
- 1035 Milford Dr
- 1058 Milford Dr
- 12335 Thoroughbred Dr
- 12316 Thoroughbred Dr
- 964 Dunmore Ct
- 12394 Bentwood Farms Dr
- 8950 Easton Dr
- 812 Melrose Blvd
- 756 Stewart Ct
- 891 Dunvegan Cir
- 11608 Meadow Ave
- 12052 Peppermill Ln
- 8294 Morgan St
- 825 Brookside Dr
- Magnolia Plan at Graystone - Designer Collection
- Grandin Plan at Graystone - Designer Collection
- Calvin Plan at Graystone - Designer Collection
- Wyatt Plan at Graystone - Designer Collection
- Blair Plan at Graystone - Designer Collection
- 12020 Sheldrake Ct
- 12026 Sheldrake Ct
- 12022 Auburn Ct
- 12066 Auburn Ct
- 12017 Sheldrake Ct
- 12023 Sheldrake Ct
- 12011 Sheldrake Ct
- 12088 Auburn Ct
- 1044 Milford Dr
- 1046 Milford Dr
- 1042 Milford Dr
- 12150 Mallard Pond Dr
- 12098 Mallard Pond Dr
- 9075 Auburn Dr
- 1048 Milford Dr
- 1040 Milford Dr
- 12076 Mallard Pond Dr
- 12172 Mallard Pond Dr
- 12054 Mallard Pond Dr
- 12108 Auburn Ct