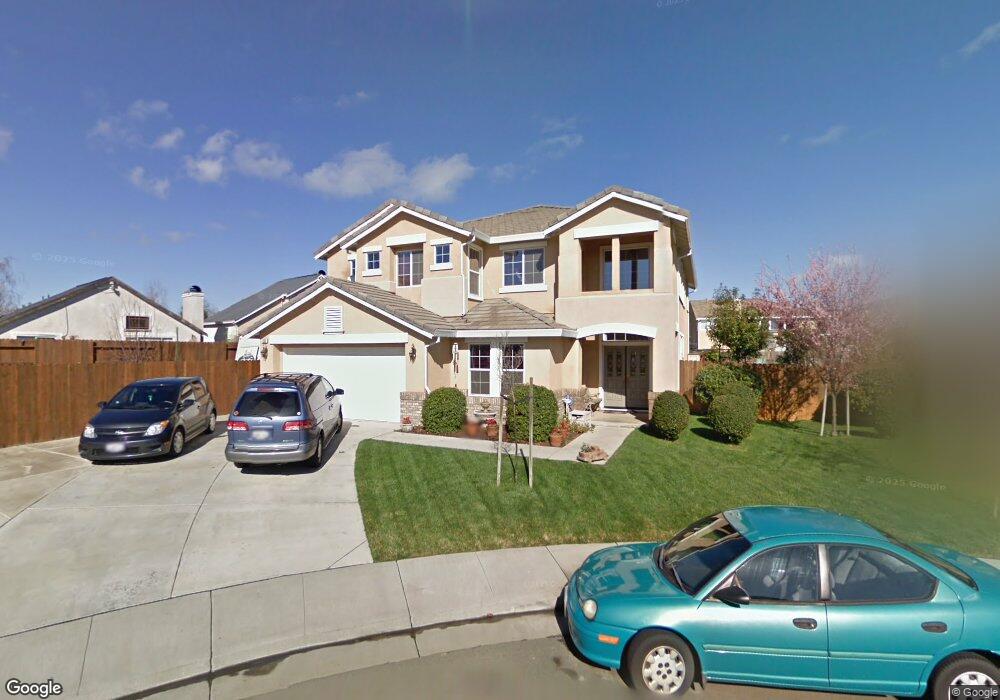
1202 Catamaran Ct Fairfield, CA 94533
Estimated Value: $771,000 - $910,476
6
Beds
4
Baths
3,551
Sq Ft
$236/Sq Ft
Est. Value
About This Home
This home is located at 1202 Catamaran Ct, Fairfield, CA 94533 and is currently estimated at $836,369, approximately $235 per square foot. 1202 Catamaran Ct is a home located in Solano County with nearby schools including Laurel Creek Elementary School, Grange Middle School, and Fairfield High School.
Ownership History
Date
Name
Owned For
Owner Type
Purchase Details
Closed on
Apr 27, 2020
Sold by
Thoming Richard and Thoming Kathie
Bought by
Thoming Richard and Thoming Kathie
Current Estimated Value
Home Financials for this Owner
Home Financials are based on the most recent Mortgage that was taken out on this home.
Original Mortgage
$220,000
Outstanding Balance
$196,035
Interest Rate
3.6%
Mortgage Type
New Conventional
Estimated Equity
$640,334
Purchase Details
Closed on
Aug 1, 2018
Sold by
Thoming Richard and Thoming Kathie
Bought by
Thoming Richard Lewis and Thoming Kathie Lee
Purchase Details
Closed on
Apr 17, 2002
Sold by
Woodlake Lp
Bought by
Thoming Richard and Thoming Kathie
Home Financials for this Owner
Home Financials are based on the most recent Mortgage that was taken out on this home.
Original Mortgage
$325,000
Interest Rate
6.52%
Create a Home Valuation Report for This Property
The Home Valuation Report is an in-depth analysis detailing your home's value as well as a comparison with similar homes in the area
Home Values in the Area
Average Home Value in this Area
Purchase History
| Date | Buyer | Sale Price | Title Company |
|---|---|---|---|
| Thoming Richard | -- | Old Republic Title Company | |
| Thoming Richard | -- | Old Republic Title Company | |
| Thoming Richard Lewis | -- | None Available | |
| Thoming Richard | $408,000 | Chicago Title Co |
Source: Public Records
Mortgage History
| Date | Status | Borrower | Loan Amount |
|---|---|---|---|
| Open | Thoming Richard | $220,000 | |
| Previous Owner | Thoming Richard | $325,000 |
Source: Public Records
Tax History
| Year | Tax Paid | Tax Assessment Tax Assessment Total Assessment is a certain percentage of the fair market value that is determined by local assessors to be the total taxable value of land and additions on the property. | Land | Improvement |
|---|---|---|---|---|
| 2025 | $7,060 | $625,757 | $144,825 | $480,932 |
| 2024 | $7,060 | $613,488 | $141,986 | $471,502 |
| 2023 | $8,245 | $601,459 | $139,202 | $462,257 |
| 2022 | $8,162 | $589,667 | $136,473 | $453,194 |
| 2021 | $8,096 | $578,106 | $133,798 | $444,308 |
| 2020 | $7,941 | $572,180 | $132,427 | $439,753 |
| 2019 | $7,782 | $560,962 | $129,831 | $431,131 |
| 2018 | $8,192 | $549,964 | $127,286 | $422,678 |
| 2017 | $7,890 | $539,182 | $124,791 | $414,391 |
| 2016 | $7,851 | $528,611 | $122,345 | $406,266 |
| 2015 | $7,223 | $501,000 | $95,000 | $406,000 |
| 2014 | $7,059 | $481,000 | $96,000 | $385,000 |
Source: Public Records
Map
Nearby Homes
- 2913 Willow Ct
- 2913 Balsam Ct
- 1336 Renewal Ln
- 1512 Millennium Way
- 1328 Horizon Cir
- 1516 Millennium Way
- 1520 Millennium Way
- 1532 Millennium Way
- 3045 Balance Cir
- 1552 Millennium Way
- 1571 Tommy Ln
- 2612 Newberry St
- 2915 Shaver St
- 2972 Newberry Ct
- 2645 Newberry St
- 1464 Descanso Ln
- 1492 Monument Ln
- 1488 Monument Ln
- 1476 Monument Ln
- 1468 Monument Ln
- 1206 Catamaran Ct
- 2894 Candleberry Way
- 2888 Candleberry Way Unit 7
- 2884 Candleberry Way
- 1205 Minnow Ct
- 1210 Catamaran Ct Unit 1
- 2896 Candleberry Way
- 1201 Minnow Ct
- 1201 Catamaran Ct
- 2880 Candleberry Way
- 1209 Minnow Ct
- 1205 Catamaran Ct
- 2876 Candleberry Way
- 1209 Catamaran Ct Unit 1
- 1156 Buckthorn Ln
- 2900 Candleberry Way
- 2872 Candleberry Way
- 1155 Buckthorn Ln
- 1161 Willow Ln
Your Personal Tour Guide
Ask me questions while you tour the home.