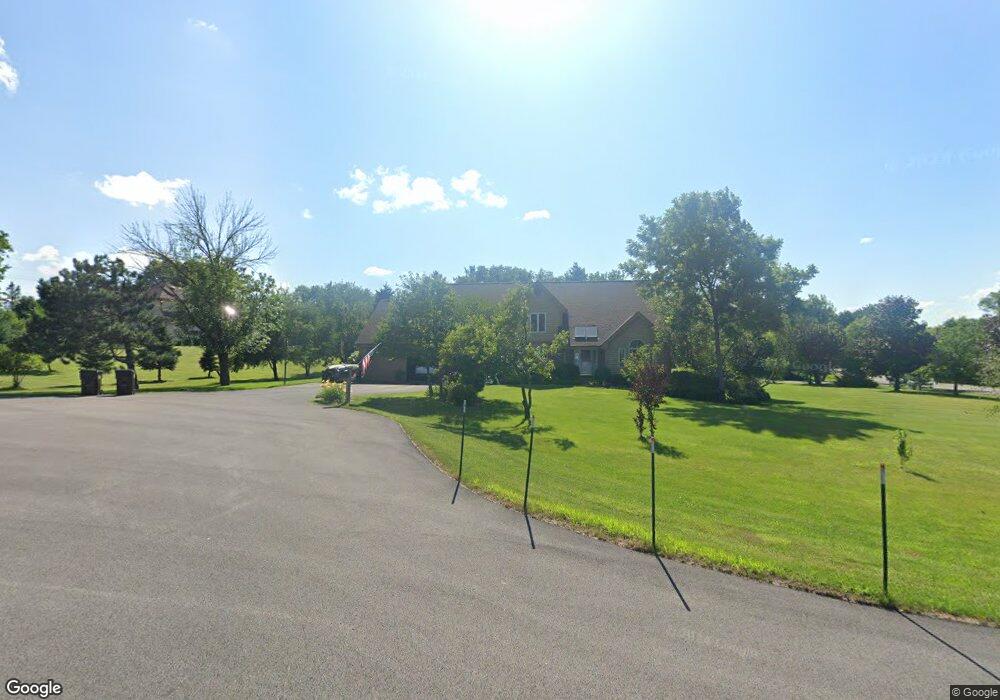
1202 Jonathon Ct Wauconda, IL 60084
Estimated Value: $539,000 - $765,000
4
Beds
4
Baths
2,388
Sq Ft
$255/Sq Ft
Est. Value
About This Home
This home is located at 1202 Jonathon Ct, Wauconda, IL 60084 and is currently estimated at $608,817, approximately $254 per square foot. 1202 Jonathon Ct is a home located in Lake County with nearby schools including Fremont Elementary School, Fremont Intermediate School, and Fremont Jr High/Middle School.
Ownership History
Date
Name
Owned For
Owner Type
Purchase Details
Closed on
Dec 8, 2006
Sold by
Miller Edward F and Miller Sandra A
Bought by
Rabeler Michael R and Rabeler Mary L
Current Estimated Value
Home Financials for this Owner
Home Financials are based on the most recent Mortgage that was taken out on this home.
Original Mortgage
$350,000
Outstanding Balance
$209,837
Interest Rate
6.36%
Mortgage Type
Purchase Money Mortgage
Estimated Equity
$398,980
Purchase Details
Closed on
May 11, 2001
Sold by
Gick Michael P
Bought by
Miller Edward F and Miller Sandra A
Home Financials for this Owner
Home Financials are based on the most recent Mortgage that was taken out on this home.
Original Mortgage
$230,000
Interest Rate
7.02%
Purchase Details
Closed on
May 13, 1997
Sold by
Jones Patricia A and Gick Patricia A
Bought by
Gick Michael P
Create a Home Valuation Report for This Property
The Home Valuation Report is an in-depth analysis detailing your home's value as well as a comparison with similar homes in the area
Home Values in the Area
Average Home Value in this Area
Purchase History
| Date | Buyer | Sale Price | Title Company |
|---|---|---|---|
| Rabeler Michael R | $465,000 | Multiple | |
| Miller Edward F | $356,000 | First American Title | |
| Gick Michael P | -- | -- |
Source: Public Records
Mortgage History
| Date | Status | Borrower | Loan Amount |
|---|---|---|---|
| Open | Rabeler Michael R | $350,000 | |
| Previous Owner | Miller Edward F | $230,000 |
Source: Public Records
Tax History Compared to Growth
Tax History
| Year | Tax Paid | Tax Assessment Tax Assessment Total Assessment is a certain percentage of the fair market value that is determined by local assessors to be the total taxable value of land and additions on the property. | Land | Improvement |
|---|---|---|---|---|
| 2024 | $13,559 | $159,184 | $21,214 | $137,970 |
| 2023 | $11,894 | $149,985 | $19,437 | $130,548 |
| 2022 | $11,894 | $127,223 | $21,339 | $105,884 |
| 2021 | $11,412 | $122,767 | $20,592 | $102,175 |
| 2020 | $11,447 | $119,388 | $20,025 | $99,363 |
| 2019 | $13,548 | $139,347 | $19,367 | $119,980 |
| 2018 | $13,238 | $139,136 | $32,340 | $106,796 |
| 2017 | $13,081 | $134,756 | $31,322 | $103,434 |
| 2016 | $12,630 | $127,985 | $29,748 | $98,237 |
| 2015 | $12,195 | $119,982 | $27,888 | $92,094 |
| 2014 | $11,644 | $114,538 | $26,944 | $87,594 |
| 2012 | $11,863 | $115,555 | $27,183 | $88,372 |
Source: Public Records
Map
Nearby Homes
- 1260 Water Stone Cir
- 0 Bonner Rd
- 28722 N Madison Ave
- 701 Lake Shore Dr
- 29564 N Garland Rd
- 315 Grand Blvd
- 302 Stillwater Ct Unit 1702
- 303 Stillwater Ct Unit 1106
- 309 Stillwater Ct Unit 1101
- 315 Hill St Unit A
- 28177 N Garland Rd
- 26049 N Il Route 59
- 325 Sundown Ct Unit B
- 310 Sundown Ct Unit E
- 2403 Goldenrod Way
- 26241 W Bonner Rd
- 2472 Olivia Ct
- 136 Parkview Dr Unit 5136
- 2486 Olivia Ct
- 2490 Olivia Ct
- 1200 Macintosh Dr
- 1209 Macintosh Dr
- 1203 Macintosh Dr
- 1208 Jonathon Ct
- 1204 Jonathon Ct
- 1207 Macintosh Dr
- 1206 Jonathon Ct
- 1201 Macintosh Dr
- 1205 Macintosh Dr
- 1210 Macintosh Dr
- 1211 Macintosh Dr
- 1140 Erica Dr
- 1165 Erica Dr
- 1155 Erica Dr
- 1101 E Bonner Rd
- 1203 E Bonner Rd
- 1201 E Bonner Rd
- 1071 E Bonner Rd
- 1160 Wauconda Rd
- 1145 Erica Dr