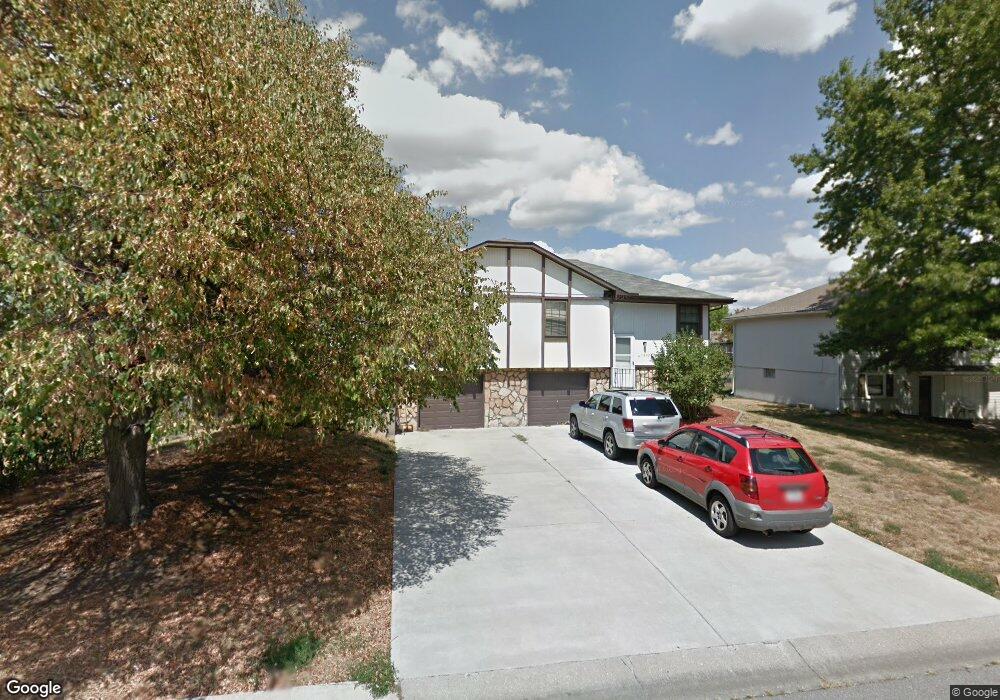
1202 SE 3rd Terrace Unit A Lees Summit, MO 64063
Estimated Value: $278,000 - $361,764
6
Beds
4
Baths
1,596
Sq Ft
$201/Sq Ft
Est. Value
About This Home
This home is located at 1202 SE 3rd Terrace Unit A, Lees Summit, MO 64063 and is currently estimated at $321,441, approximately $201 per square foot. 1202 SE 3rd Terrace Unit A is a home located in Jackson County with nearby schools including Pleasant Lea Middle School, Lee's Summit Senior High School, and Summit Christian Academy.
Ownership History
Date
Name
Owned For
Owner Type
Purchase Details
Closed on
Oct 31, 2024
Sold by
Smith Erin and Smith Erin G
Bought by
A & R Realty Llc
Current Estimated Value
Home Financials for this Owner
Home Financials are based on the most recent Mortgage that was taken out on this home.
Original Mortgage
$262,500
Outstanding Balance
$259,872
Interest Rate
6.09%
Mortgage Type
New Conventional
Estimated Equity
$61,569
Purchase Details
Closed on
Dec 29, 2023
Sold by
Smith Lucas J
Bought by
Smith Erin G
Purchase Details
Closed on
Nov 15, 2019
Sold by
C1 Oak Grove Llc
Bought by
Smith Erin
Home Financials for this Owner
Home Financials are based on the most recent Mortgage that was taken out on this home.
Original Mortgage
$176,175
Interest Rate
3.65%
Mortgage Type
New Conventional
Purchase Details
Closed on
Jan 2, 2013
Sold by
Calton Ila J
Bought by
C1 Oak Grove Llc
Create a Home Valuation Report for This Property
The Home Valuation Report is an in-depth analysis detailing your home's value as well as a comparison with similar homes in the area
Home Values in the Area
Average Home Value in this Area
Purchase History
| Date | Buyer | Sale Price | Title Company |
|---|---|---|---|
| A & R Realty Llc | -- | Coffelt Land Title | |
| Smith Erin G | -- | None Listed On Document | |
| Smith Erin | -- | Stewart Title Company | |
| C1 Oak Grove Llc | -- | None Available |
Source: Public Records
Mortgage History
| Date | Status | Borrower | Loan Amount |
|---|---|---|---|
| Open | A & R Realty Llc | $262,500 | |
| Previous Owner | Smith Erin | $176,175 |
Source: Public Records
Tax History
| Year | Tax Paid | Tax Assessment Tax Assessment Total Assessment is a certain percentage of the fair market value that is determined by local assessors to be the total taxable value of land and additions on the property. | Land | Improvement |
|---|---|---|---|---|
| 2025 | $4,558 | $50,506 | $7,556 | $42,950 |
| 2024 | $4,525 | $63,131 | $6,399 | $56,732 |
| 2023 | $4,525 | $63,131 | $8,377 | $54,754 |
| 2022 | $3,083 | $38,190 | $3,914 | $34,276 |
| 2021 | $3,147 | $38,190 | $3,914 | $34,276 |
| 2020 | $2,784 | $33,454 | $3,914 | $29,540 |
| 2019 | $2,708 | $33,454 | $3,914 | $29,540 |
| 2018 | $2,539 | $29,115 | $3,406 | $25,709 |
| 2017 | $2,539 | $29,115 | $3,406 | $25,709 |
| 2016 | $2,501 | $28,386 | $3,211 | $25,175 |
Source: Public Records
Map
Nearby Homes
- 1111 SE 2nd Ct
- 308 SE Colony Dr
- 1205 SE 5th St
- 1015 SE 3rd Terrace
- 101 SE Brentwood Dr
- 525 SE Vista Dr
- 1201 SE 7th St
- 1308 SE 7th St
- 405 NE Dogwood Ln
- 27012 E Dogwood Ln
- 1619 SE Boone Trail
- 400 A-B NE Westwind Dr
- 404 NE Castle Dr
- 705 NE Noeleen Ln
- 729 SE Claremont St
- 1104 NE Columbus St
- 613 SE Westwind Dr
- 408 NE Deerfield Ct
- 412 NE Deerfield Ct
- 1625 NE Debonair Dr
- 1204 SE 3rd Terrace Unit B
- 1202 SE 3rd Terrace
- 1206 SE 3rd Terrace Unit A
- 1116 SE 3rd Terrace
- 306 SE Wingate St
- 218 SE Wingate St Unit A
- 218 SE Wingate St
- 1205 SE 3rd Terrace
- 1205 SE 3rd St
- 1205 SE 3rd St Unit A
- 1117 SE 3rd Terrace
- 1114 SE 3rd Terrace
- 1208 SE 3rd Terrace Unit A
- 1208 SE 3rd Terrace
- 308 SE Wingate St
- 114 & SE Summit Ave
- 4 AC Vista Drive and 50 Hwy
- 2.7 AC NW 50 Hwy and Vista Dr
- 1405 & 1407 SE 7th Place
- 412 NE Main St