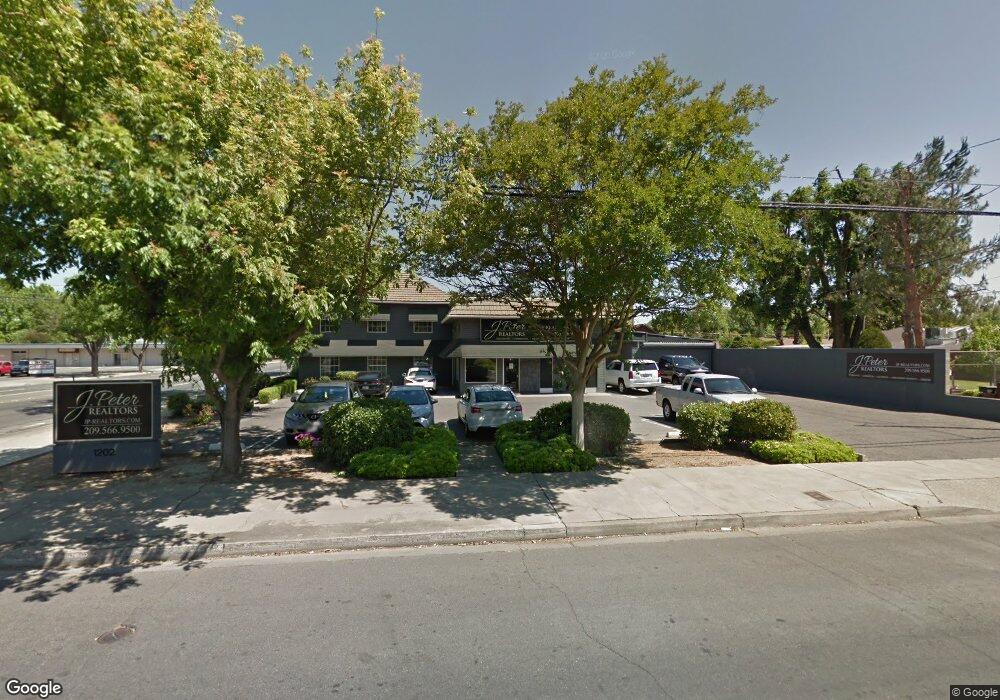
1202 Tully Rd Modesto, CA 95350
Central Modesto NeighborhoodEstimated Value: $606,464
Studio
--
Bath
--
Sq Ft
16,553
Sq Ft Lot
About This Home
This home is located at 1202 Tully Rd, Modesto, CA 95350 and is currently estimated at $606,464. 1202 Tully Rd is a home located in Stanislaus County with nearby schools including John Fremont Elementary School, Roosevelt Junior High School, and Grace M. Davis High School.
Ownership History
Date
Name
Owned For
Owner Type
Purchase Details
Closed on
May 21, 2014
Sold by
Buchler Amy E
Bought by
Real Estate Exchange Group Llc
Current Estimated Value
Purchase Details
Closed on
Feb 7, 2013
Sold by
Tri Counties Bank
Bought by
Buchler Amy E
Purchase Details
Closed on
Feb 6, 2013
Sold by
Buchler Michael R
Bought by
Buchler Amy E
Purchase Details
Closed on
Nov 15, 2012
Sold by
Hibl Douglas R and Hibl Olga A
Bought by
Tri Counties Bank
Purchase Details
Closed on
Feb 6, 2003
Sold by
Fosnaugh Marianne
Bought by
Fosnaugh Brian
Purchase Details
Closed on
Nov 13, 2002
Sold by
Hibl Douglas R and Hibl Olga A
Bought by
Hibl Douglas and Hibl Olga
Purchase Details
Closed on
Dec 14, 2000
Sold by
Fosnaugh Marianne
Bought by
Fosnaugh Brian J and Fosnaugh Marianne D
Purchase Details
Closed on
Jan 22, 1998
Sold by
Fosnaugh Barbara Jean
Bought by
Fosnaugh Brian J and Fosnaugh Marianne Denise
Create a Home Valuation Report for This Property
The Home Valuation Report is an in-depth analysis detailing your home's value as well as a comparison with similar homes in the area
Home Values in the Area
Average Home Value in this Area
Purchase History
| Date | Buyer | Sale Price | Title Company |
|---|---|---|---|
| Real Estate Exchange Group Llc | $285,000 | North American Title Co Inc | |
| Buchler Amy E | $284,000 | Old Republic Title Company | |
| Buchler Amy E | -- | Old Republic Title Company | |
| Tri Counties Bank | $226,391 | None Available | |
| Fosnaugh Brian | -- | None Available | |
| Hibl Douglas | -- | -- | |
| Fosnaugh Brian J | -- | -- | |
| Fosnaugh Brian J | -- | -- |
Source: Public Records
Tax History
| Year | Tax Paid | Tax Assessment Tax Assessment Total Assessment is a certain percentage of the fair market value that is determined by local assessors to be the total taxable value of land and additions on the property. | Land | Improvement |
|---|---|---|---|---|
| 2025 | $4,085 | $349,361 | $180,198 | $169,163 |
| 2024 | $3,903 | $342,512 | $176,665 | $165,847 |
| 2023 | $3,845 | $335,797 | $173,201 | $162,596 |
| 2022 | $3,752 | $329,213 | $169,805 | $159,408 |
| 2021 | $3,529 | $322,759 | $166,476 | $156,283 |
| 2020 | $3,598 | $319,450 | $164,769 | $154,681 |
| 2019 | $3,515 | $313,188 | $161,539 | $151,649 |
| 2018 | $3,346 | $307,048 | $158,372 | $148,676 |
| 2017 | $3,266 | $301,028 | $155,267 | $145,761 |
| 2016 | $3,204 | $295,126 | $152,223 | $142,903 |
| 2015 | $3,161 | $290,694 | $149,937 | $140,757 |
| 2014 | $3,115 | $285,288 | $140,635 | $144,653 |
Source: Public Records
Map
Nearby Homes
- 1123 Tully Rd
- 1301 Oakwood Dr
- 1305 Oakwood Dr
- 1317 Oakwood Dr
- 1409 Cherrywood Dr
- 1424 W Roseburg Ave
- 1402 W Orangeburg Ave
- 919 Del Rey Ave
- 1125 Wellesley Ave
- 1412 Fordham Ave
- 1436 Albany Ave
- 820 Tully Rd
- 805 Tully Rd Unit 5
- 805 Tully Rd Unit 30
- 1602 Del Monte Ave
- 1403 Leonard Ave
- 1122 Trinity Ave
- 1617 Ashwood Dr
- 1608 Teresa St
- 1322 Carver Rd
- 1210 Tully Rd
- 1233 W Roseburg Ave
- 1201 Tully Rd
- 1235 W Roseburg Ave
- 1228 Tully Rd
- 1248 W Roseburg Ave
- 1248 W Roseburg Ave Unit A
- 1248 W Roseburg Ave Unit C
- 1248 W Roseburg Ave Unit B
- 1225 W Roseburg Ave
- 1244 W Roseburg Ave Unit A
- 1244 W Roseburg Ave Unit D
- 1244 W Roseburg Ave Unit C
- 1244 W Roseburg Ave Unit B
- 1238 College Ct
- 1234 College Ct
- 1301 Del Monte Ave
- 1230 College Ct
- 1308 W Roseburg Ave
- 1226 College Ct
Your Personal Tour Guide
Ask me questions while you tour the home.