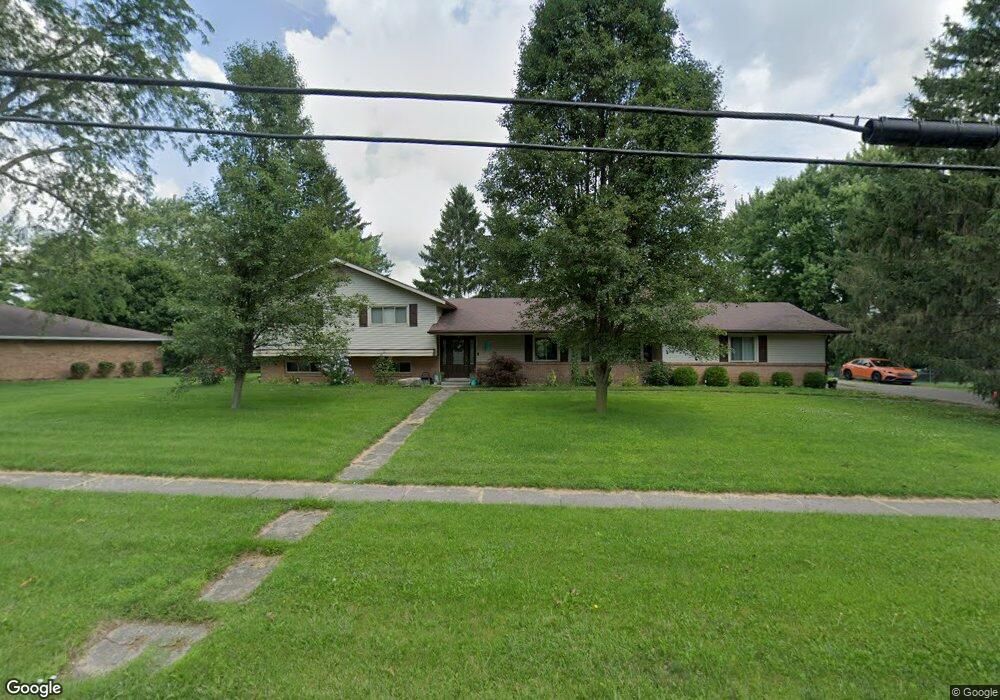
1203 E Centerville Station Rd Dayton, OH 45459
Estimated Value: $392,733 - $467,000
4
Beds
4
Baths
2,199
Sq Ft
$189/Sq Ft
Est. Value
About This Home
This home is located at 1203 E Centerville Station Rd, Dayton, OH 45459 and is currently estimated at $415,933, approximately $189 per square foot. 1203 E Centerville Station Rd is a home located in Montgomery County with nearby schools including Primary Village North, Stingley Elementary School, and Tower Heights Middle School.
Ownership History
Date
Name
Owned For
Owner Type
Purchase Details
Closed on
Jun 22, 2017
Sold by
James Construction And Renovation Llc
Bought by
Buchanan Christopher L and Buchanan Lindsay M
Current Estimated Value
Home Financials for this Owner
Home Financials are based on the most recent Mortgage that was taken out on this home.
Original Mortgage
$268,545
Outstanding Balance
$218,371
Interest Rate
3.75%
Mortgage Type
FHA
Estimated Equity
$197,562
Purchase Details
Closed on
Aug 1, 2016
Sold by
Niswonger Patricia R
Bought by
James Construction And Renvoation Llc
Purchase Details
Closed on
Dec 3, 2015
Sold by
Wiley Guy
Bought by
Niswonger Patricia R and The Guy Wiley Jr Irrevocable Trust
Purchase Details
Closed on
Apr 9, 2007
Sold by
Wiley Guy and Wiley Carol P
Bought by
Wiley Carol P and Wiley Guy
Create a Home Valuation Report for This Property
The Home Valuation Report is an in-depth analysis detailing your home's value as well as a comparison with similar homes in the area
Purchase History
We collect this data history from publicly available records. To have your information removed, we recommend requesting removal directly through your county’s website.
| Date | Buyer | Sale Price | Title Company |
|---|---|---|---|
| Buchanan Christopher L | $273,500 | Landmark Title Agency South | |
| James Construction And Renvoation Llc | $140,800 | None Available | |
| Niswonger Patricia R | -- | None Available | |
| Wiley Carol P | -- | Attorney |
Source: Public Records
Mortgage History
We collect this data history from publicly available records. To have your information removed, we recommend requesting removal directly through your county’s website.
| Date | Status | Borrower | Loan Amount |
|---|---|---|---|
| Open | Buchanan Christopher L | $268,545 |
Source: Public Records
Tax History
| Year | Tax Paid | Tax Assessment Tax Assessment Total Assessment is a certain percentage of the fair market value that is determined by local assessors to be the total taxable value of land and additions on the property. | Land | Improvement |
|---|---|---|---|---|
| 2025 | $7,532 | $118,690 | $21,740 | $96,950 |
| 2024 | $6,886 | $118,690 | $21,740 | $96,950 |
| 2023 | $6,886 | $118,690 | $21,740 | $96,950 |
| 2022 | $6,289 | $85,950 | $15,750 | $70,200 |
| 2021 | $6,306 | $85,950 | $15,750 | $70,200 |
| 2020 | $6,297 | $85,950 | $15,750 | $70,200 |
| 2019 | $5,769 | $70,260 | $15,750 | $54,510 |
| 2018 | $5,113 | $70,260 | $15,750 | $54,510 |
| 2017 | $5,183 | $70,260 | $15,750 | $54,510 |
| 2016 | $4,206 | $63,890 | $15,750 | $48,140 |
| 2015 | $4,163 | $63,890 | $15,750 | $48,140 |
| 2014 | $4,163 | $63,890 | $15,750 | $48,140 |
| 2012 | -- | $58,950 | $17,500 | $41,450 |
Source: Public Records
Map
Nearby Homes
- 7851 Millerton Dr
- 7715 Park Creek Dr
- 8044 Station House Rd
- 861 Kelsey Ct
- 8470 Koster Ln
- 2439 Beechknoll Point
- 7880 John Elwood Dr
- 1921 Washington Creek Ln
- 7147 Fallen Oak Trace Unit 628
- 125 Boyce Rd
- 2471 Beechknoll Ct
- 7060 Fallen Oak Trace Unit 1151
- 7053 Fallen Oak Trace Unit 1364
- 7044 Fallen Oak Trace Unit 1467
- 6962 Wembley Cir Unit 6962
- 7821 Stanley Mill Dr
- 1962 E Spring Valley Pike
- 8951 Deep Forest Ln
- 9019 Woodstream Ln
- 1161 Bournemouth Ct Unit 2222B11
- 1205 E Centerville Station Rd
- 1201 E Centerville Station Rd
- 1440 Delynn Dr
- 1450 Delynn Dr
- 7870 Raintree Rd
- 1207 E Centerville Station Rd
- 7899 Raintree Rd
- 7897 Raintree Rd
- 1445 Delynn Dr
- 1455 Delynn Dr
- 7860 Raintree Rd
- 1209 E Centerville Station Rd
- 1465 Delynn Dr
- 1462 Delynn Dr
- 7875 Raintree Rd
- 7882 Millerton Dr
- 7891 Old Dobbin Place
- 1440 Peck Ln
- 1229 E Centerville Station Rd
- 1472 Delynn Dr
Your Personal Tour Guide
Ask me questions while you tour the home.