1203 E Central Ave Redlands, CA 92374
North Redlands NeighborhoodAbout This Home
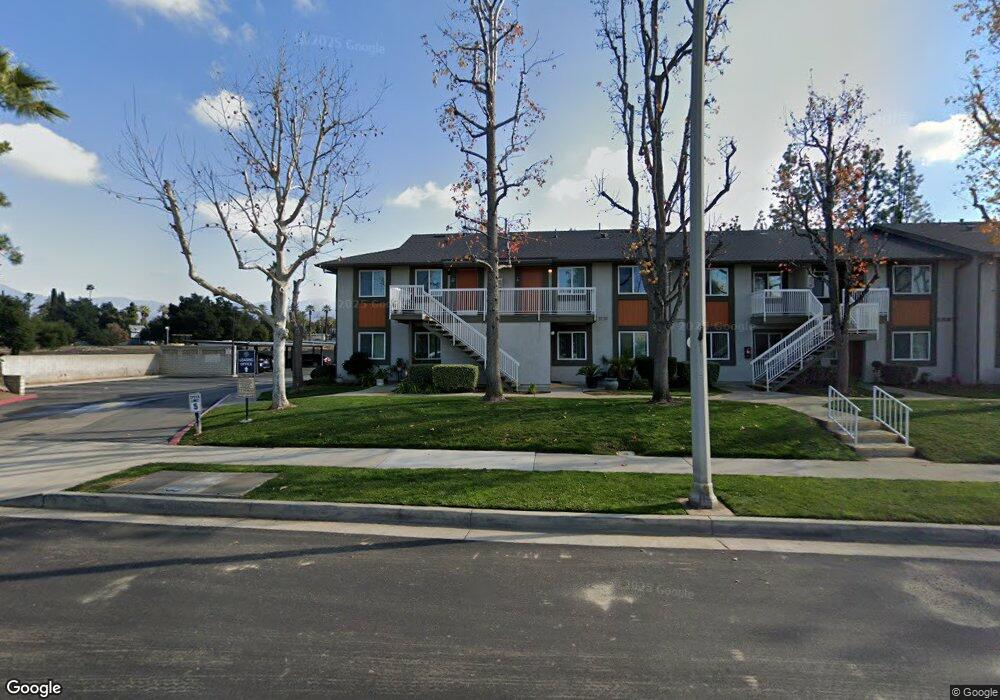
Proudly introducing Aspire Redlands Apartments, a modern community where comfort, leisure, and entertainment shape your daily life. Just minutes away from the vibrant Citrus Plaza, Loma Linda University, and countless local attractions, these Redlands apartments offer all the comforts you desire, along with cozy social nooks where you can connect. Explore everything we have to offer below!
Timeless elegance and convenience blend seamlessly inside your new home. Featuring one or two spacious bedrooms, a fully equipped kitchen, and large patios or balconies, these residences truly have it all. Enjoy a warm and inviting ambiance from the moment you walk in, feel the plush carpets soften your every step, and rest assured about the temperaturethese apartments in Redlands feature ceiling fans, as well as air conditioning and heating systems to keep you cozy year-round.
Take a virtual tour through our photo gallery to get a glimpse of the exceptional apartment community near San Bernardino, California. However, to truly experience the charm of Aspire Redlands, we invite you to schedule a personal visit. Contact us today and embark on a tour to discover why Aspire Redlands is the perfect place to call home!
Home Values in the Area
Average Home Value in this Area
Property History
| Date | Event | Price | List to Sale | Price per Sq Ft |
|---|---|---|---|---|
| 03/05/2025 03/05/25 | Off Market | -- | -- | -- |
| 01/17/2025 01/17/25 | For Rent | -- | -- | -- |
| 11/04/2024 11/04/24 | Off Market | -- | -- | -- |
| 07/09/2024 07/09/24 | For Rent | -- | -- | -- |
Tax History
| Year | Tax Paid | Tax Assessment Tax Assessment Total Assessment is a certain percentage of the fair market value that is determined by local assessors to be the total taxable value of land and additions on the property. | Land | Improvement |
|---|---|---|---|---|
| 2025 | $173,870 | $13,941,360 | $3,121,200 | $10,820,160 |
| 2024 | $162,348 | $13,668,000 | $3,060,000 | $10,608,000 |
| 2023 | $40,434 | $3,228,922 | $484,341 | $2,744,581 |
| 2022 | $39,869 | $3,165,610 | $474,844 | $2,690,766 |
| 2021 | $40,572 | $3,103,539 | $465,533 | $2,638,006 |
| 2020 | $39,990 | $3,071,716 | $460,760 | $2,610,956 |
| 2019 | $38,910 | $3,011,486 | $451,725 | $2,559,761 |
| 2018 | $37,975 | $2,952,438 | $442,868 | $2,509,570 |
| 2017 | $37,668 | $2,894,547 | $434,184 | $2,460,363 |
| 2016 | $37,260 | $2,837,792 | $425,671 | $2,412,121 |
| 2015 | $36,995 | $2,795,166 | $419,277 | $2,375,889 |
| 2014 | $36,352 | $2,740,413 | $411,064 | $2,329,349 |
Map
- 455 Judson St Unit 9
- 217 Judson St
- 1032 Ardmore Cir
- 1427 Laramie Ave
- 450 Judson St Unit 94
- 506 Lytle St
- 15 Naomi St
- 1089 Ardmore Cir
- 259 East Dr
- 1017 E Colton Ave
- 1049 Evergreen Ct
- 1326 Campus Ave
- 936 Judson St
- 616 N Lincoln St
- 1528 Laramie Ave
- 632 Church St
- 1479 Moore St
- 1200 E Highland Ave Unit 207
- 1452 Moore St
- 1442 Moore St
- 1207 E Central Ave Unit 1/2
- 1207 E Central Ave
- 1209 1/2 E Central Ave
- 1209 E Central Ave
- 1211 E Central Ave
- 341 N Grove St
- 1221 E Central Ave
- 1223 E Central Ave
- 325 N Grove St
- 217 N Grove St
- 337 Cook St
- 1225 E Central Ave
- 209 N Grove St
- 1143 E Central Ave
- 203 N Grove St
- 338 N Grove St
- 1144 E Central Ave
- 334 N Grove St
- 1301 E Central Ave
- 214 N Grove St
Ask me questions while you tour the home.