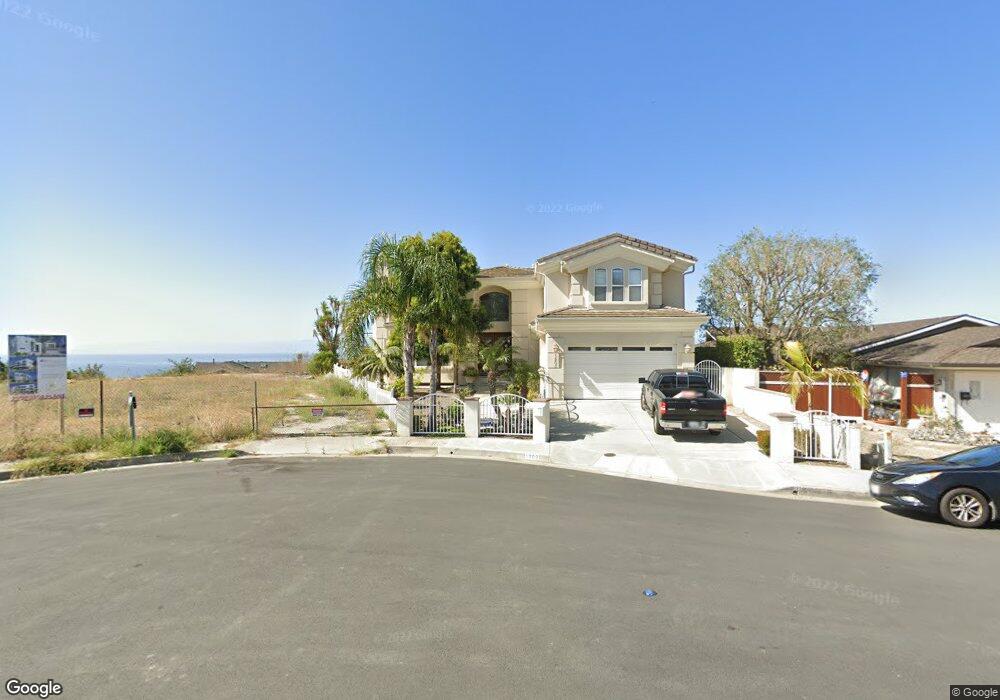
1203 Via la Mesa San Clemente, CA 92672
Southeast San Clemente NeighborhoodEstimated Value: $2,810,000 - $3,636,000
5
Beds
4
Baths
3,519
Sq Ft
$899/Sq Ft
Est. Value
About This Home
This home is located at 1203 Via la Mesa, San Clemente, CA 92672 and is currently estimated at $3,164,817, approximately $899 per square foot. 1203 Via la Mesa is a home located in Orange County with nearby schools including Concordia Elementary School, Shorecliffs Middle School, and San Clemente High School.
Ownership History
Date
Name
Owned For
Owner Type
Purchase Details
Closed on
Jan 7, 2013
Sold by
Poola Vivek R and Poola Nivedita R
Bought by
Chennapoolatwo Lp
Current Estimated Value
Purchase Details
Closed on
Dec 31, 2012
Sold by
Poola Vivek R and Poola Nivedita R
Bought by
Chennapoolatwo Lp
Purchase Details
Closed on
Dec 27, 2012
Sold by
Poola Raman S and Poola Vanishree R
Bought by
Poola Vivek R and Poola Nivedita R
Purchase Details
Closed on
Mar 30, 2011
Sold by
Via La Mesa Trust #1203
Bought by
Poola Raman and Poola Vanishree R
Home Financials for this Owner
Home Financials are based on the most recent Mortgage that was taken out on this home.
Original Mortgage
$415,000
Interest Rate
3.75%
Mortgage Type
New Conventional
Purchase Details
Closed on
Jun 29, 2010
Sold by
Wallace Philip and Wallace Susan
Bought by
Via La Mesa Trust #1203 and Rpv Investment Group Llc
Purchase Details
Closed on
Oct 18, 2006
Sold by
Wallace Philip
Bought by
Wallace Philip and Wallace Susan
Home Financials for this Owner
Home Financials are based on the most recent Mortgage that was taken out on this home.
Original Mortgage
$968,000
Interest Rate
7.44%
Mortgage Type
New Conventional
Purchase Details
Closed on
Sep 17, 2004
Sold by
Meyer Ilene
Bought by
Wallace Philip and Wallace Susan
Home Financials for this Owner
Home Financials are based on the most recent Mortgage that was taken out on this home.
Original Mortgage
$956,250
Interest Rate
1%
Mortgage Type
New Conventional
Purchase Details
Closed on
Nov 17, 2000
Sold by
Farshadsefat Reza
Bought by
Meyer Ilene
Purchase Details
Closed on
Jul 20, 2000
Sold by
Farshadsefat Reza and Meyer Ilene
Bought by
Farshadsefat Reza and Meyer Ilene
Purchase Details
Closed on
Feb 29, 2000
Sold by
Ronald Mckennell and Ronald Janet
Bought by
Farshadsefat Reza and Meyer Ilene
Purchase Details
Closed on
May 13, 1998
Sold by
Paulin Joanne M
Bought by
Mckennell Ronald and Mckennell Janet
Home Financials for this Owner
Home Financials are based on the most recent Mortgage that was taken out on this home.
Original Mortgage
$95,200
Interest Rate
7.13%
Mortgage Type
Balloon
Purchase Details
Closed on
Jul 25, 1996
Sold by
Paulin Joanne M
Bought by
Paulin Joanne M and Paulin Family 1983 Trust
Create a Home Valuation Report for This Property
The Home Valuation Report is an in-depth analysis detailing your home's value as well as a comparison with similar homes in the area
Home Values in the Area
Average Home Value in this Area
Purchase History
| Date | Buyer | Sale Price | Title Company |
|---|---|---|---|
| Chennapoolatwo Lp | -- | None Available | |
| Chennapoolatwo Lp | -- | None Available | |
| Poola Vivek R | -- | None Available | |
| Poola Raman | $1,130,000 | Investors Title Company | |
| Via La Mesa Trust #1203 | $711,000 | None Available | |
| Wallace Philip | -- | Accommodation | |
| Wallace Philip | -- | United Title Company Orange | |
| Wallace Philip | $1,275,000 | California Counties Title Co | |
| Meyer Ilene | -- | -- | |
| Farshadsefat Reza | -- | Guardian Title Company | |
| Farshadsefat Reza | $170,000 | Old Republic Title Company | |
| Mckennell Ronald | $119,000 | Commonwealth Land Title | |
| Paulin Joanna | -- | Commonwealth Land Title | |
| Paulin Joanne M | -- | -- |
Source: Public Records
Mortgage History
| Date | Status | Borrower | Loan Amount |
|---|---|---|---|
| Previous Owner | Poola Raman | $415,000 | |
| Previous Owner | Wallace Philip | $968,000 | |
| Previous Owner | Wallace Philip | $956,250 | |
| Previous Owner | Mckennell Ronald | $95,200 |
Source: Public Records
Tax History Compared to Growth
Tax History
| Year | Tax Paid | Tax Assessment Tax Assessment Total Assessment is a certain percentage of the fair market value that is determined by local assessors to be the total taxable value of land and additions on the property. | Land | Improvement |
|---|---|---|---|---|
| 2025 | $14,212 | $1,430,899 | $768,896 | $662,003 |
| 2024 | $14,212 | $1,402,843 | $753,820 | $649,023 |
| 2023 | $13,911 | $1,375,337 | $739,039 | $636,298 |
| 2022 | $13,646 | $1,348,370 | $724,548 | $623,822 |
| 2021 | $13,383 | $1,321,932 | $710,341 | $611,591 |
| 2020 | $13,250 | $1,308,378 | $703,058 | $605,320 |
| 2019 | $12,989 | $1,282,724 | $689,273 | $593,451 |
| 2018 | $12,652 | $1,248,918 | $675,758 | $573,160 |
| 2017 | $12,148 | $1,198,974 | $662,508 | $536,466 |
| 2016 | $11,915 | $1,175,465 | $649,517 | $525,948 |
| 2015 | $11,736 | $1,157,809 | $639,761 | $518,048 |
| 2014 | $11,512 | $1,135,130 | $627,229 | $507,901 |
Source: Public Records
Map
Nearby Homes
- 1207 Via la Mesa
- 1205 Via Catalina
- 214 Via Robina Unit 5
- 303 E Avenida Cordoba
- 413 E Avenida Cordoba
- 100 Calle Patricia Unit 1A
- 1010 S El Camino Real Unit 101
- 605 E Avenida San Juan
- 1806 Calle Leticia
- 13 Vista Del Ponto Unit 72
- 102 Trafalgar Ln
- 235 S La Esperanza
- 221 Avenida Monterey
- 170 Avenida Presidio
- 229 Avenida Monterey Unit A
- 147 Avenida Rosa
- 1701 Avenida Salvador
- 144 Esplanade
- 147 Trafalgar Ln
- 243 Avenida Madrid
- 1205 Via la Mesa
- 1201 Via la Mesa
- 312 E Avenida Cordoba
- 1207 Via Catalina
- 318 E Avenida Cordoba
- 1209 Via Catalina
- 1215 Via Catalina
- 1206 Via la Mesa
- 1203 Via Catalina
- 1201 Via Catalina
- 1211 Via Catalina
- 315 E Avenida Cordoba
- 133 W Avenida Marquita
- 201 S So La Esperanza 7 Unit R7
- 313 E Avenida Cordoba
- 317 E Avenida Cordoba
- 320 E Avenida Cordoba
- 311 E Avenida Cordoba
- 308 E Avenida Cordoba
- 319 E Avenida Cordoba