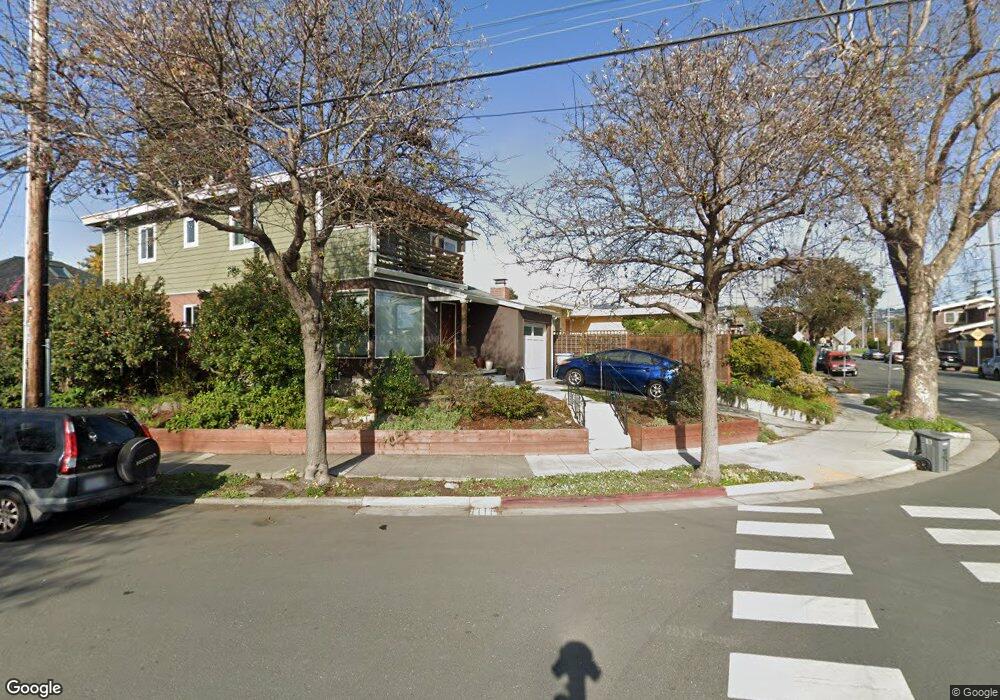
1203 Ward St Berkeley, CA 94702
West Berkeley NeighborhoodEstimated Value: $852,000 - $985,000
3
Beds
1
Bath
950
Sq Ft
$978/Sq Ft
Est. Value
About This Home
This home is located at 1203 Ward St, Berkeley, CA 94702 and is currently estimated at $929,298, approximately $978 per square foot. 1203 Ward St is a home located in Alameda County with nearby schools including Malcolm X Elementary School, Oxford Elementary School, and Washington Elementary School.
Ownership History
Date
Name
Owned For
Owner Type
Purchase Details
Closed on
Dec 30, 2003
Sold by
Goldberg Michael K and Kamrin Phyllis S
Bought by
Goldberg Michael K and Kamrin Phyllis S
Current Estimated Value
Home Financials for this Owner
Home Financials are based on the most recent Mortgage that was taken out on this home.
Original Mortgage
$100,000
Interest Rate
6.02%
Mortgage Type
New Conventional
Purchase Details
Closed on
Mar 31, 2000
Sold by
Goldberg Michael K and Kamrin Phyllis S
Bought by
Goldberg Michael K and Kamrin Phyllis S
Purchase Details
Closed on
Aug 1, 1997
Sold by
Raymond Brian
Bought by
Goldberg Michael K and Kamrin Phyllis S
Home Financials for this Owner
Home Financials are based on the most recent Mortgage that was taken out on this home.
Original Mortgage
$119,000
Interest Rate
7.57%
Create a Home Valuation Report for This Property
The Home Valuation Report is an in-depth analysis detailing your home's value as well as a comparison with similar homes in the area
Home Values in the Area
Average Home Value in this Area
Purchase History
| Date | Buyer | Sale Price | Title Company |
|---|---|---|---|
| Goldberg Michael K | -- | Placer Title Company | |
| Goldberg Michael K | -- | Placer Title Company | |
| Goldberg Michael K | -- | -- | |
| Goldberg Michael K | $169,000 | Placer Title Company |
Source: Public Records
Mortgage History
| Date | Status | Borrower | Loan Amount |
|---|---|---|---|
| Closed | Goldberg Michael K | $100,000 | |
| Closed | Goldberg Michael K | $119,000 |
Source: Public Records
Tax History
| Year | Tax Paid | Tax Assessment Tax Assessment Total Assessment is a certain percentage of the fair market value that is determined by local assessors to be the total taxable value of land and additions on the property. | Land | Improvement |
|---|---|---|---|---|
| 2025 | $4,680 | $262,837 | $80,951 | $188,886 |
| 2024 | $4,680 | $257,547 | $79,364 | $185,183 |
| 2023 | $4,574 | $259,360 | $77,808 | $181,552 |
| 2022 | $4,477 | $247,274 | $76,282 | $177,992 |
| 2021 | $4,474 | $242,290 | $74,787 | $174,503 |
| 2020 | $4,221 | $246,734 | $74,020 | $172,714 |
| 2019 | $4,036 | $241,897 | $72,569 | $169,328 |
| 2018 | $3,959 | $237,155 | $71,146 | $166,009 |
| 2017 | $3,789 | $232,506 | $69,752 | $162,754 |
| 2016 | $3,647 | $227,948 | $68,384 | $159,564 |
| 2015 | $3,596 | $224,524 | $67,357 | $157,167 |
| 2014 | $3,564 | $220,127 | $66,038 | $154,089 |
Source: Public Records
Map
Nearby Homes
- 2751 Wallace St
- 2747 San Pablo Ave Unit 507
- 1034 Grayson St
- 1010 Grayson St
- 1142 Dwight Way
- 1118 Dwight Way
- 1450 Ward St
- 2758 Sacramento St
- 2774 Sacramento St
- 2750 Sacramento St
- 2782 Sacramento St
- 2790 Sacramento St
- 1237 Ashby Ave
- 1092 Dwight Way
- 1515 Derby St
- 1314 Ashby Ave
- 2922 Stanton St
- 1530 Stuart St
- 3032 Mabel St
- 1612 Carleton St
Your Personal Tour Guide
Ask me questions while you tour the home.