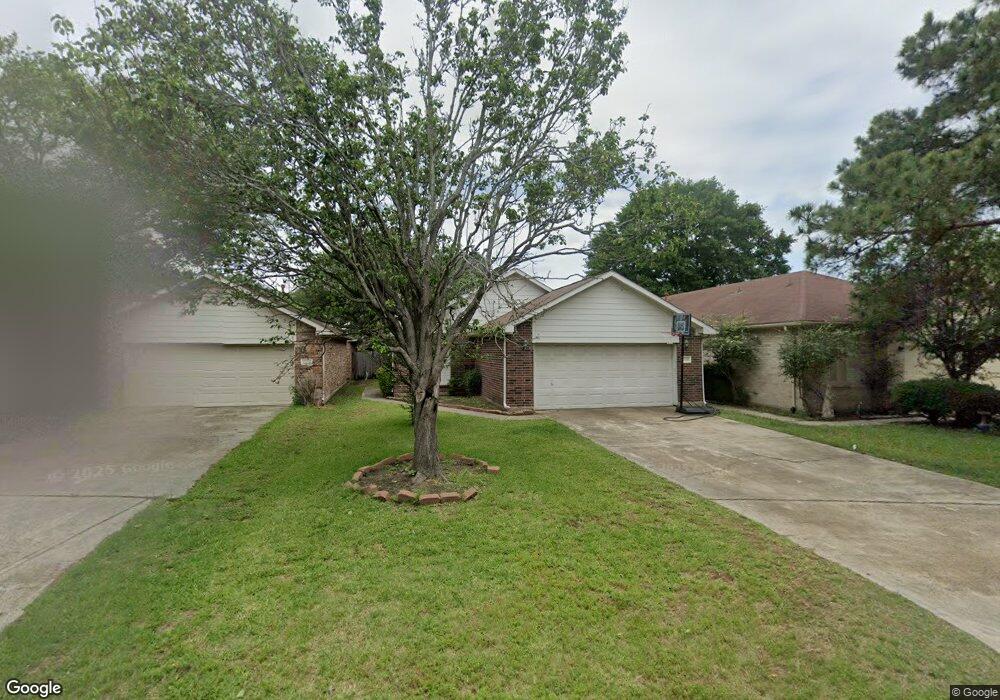
12034 Westwold Dr Tomball, TX 77377
Northpointe NeighborhoodEstimated Value: $225,000 - $250,000
3
Beds
2
Baths
1,321
Sq Ft
$178/Sq Ft
Est. Value
About This Home
This home is located at 12034 Westwold Dr, Tomball, TX 77377 and is currently estimated at $235,798, approximately $178 per square foot. 12034 Westwold Dr is a home located in Harris County with nearby schools including Willow Creek Elementary School, Willow Wood Junior High School, and Northpointe Intermediate School.
Ownership History
Date
Name
Owned For
Owner Type
Purchase Details
Closed on
Mar 24, 2017
Sold by
Ridder Michael and Ridder Kimberly
Bought by
Holley Eric
Current Estimated Value
Home Financials for this Owner
Home Financials are based on the most recent Mortgage that was taken out on this home.
Original Mortgage
$120,000
Outstanding Balance
$99,510
Interest Rate
4.17%
Mortgage Type
New Conventional
Estimated Equity
$136,288
Purchase Details
Closed on
Nov 7, 2005
Sold by
Crider Timothy L and Crider Sharon D
Bought by
Ridder Michael and Ridder Kimberly
Home Financials for this Owner
Home Financials are based on the most recent Mortgage that was taken out on this home.
Original Mortgage
$92,000
Interest Rate
5.9%
Mortgage Type
Fannie Mae Freddie Mac
Purchase Details
Closed on
Aug 11, 1998
Sold by
Jmc Homes Inc
Bought by
Crider Timothy L and Crider Sharon D
Home Financials for this Owner
Home Financials are based on the most recent Mortgage that was taken out on this home.
Original Mortgage
$69,939
Interest Rate
6.95%
Mortgage Type
FHA
Create a Home Valuation Report for This Property
The Home Valuation Report is an in-depth analysis detailing your home's value as well as a comparison with similar homes in the area
Home Values in the Area
Average Home Value in this Area
Purchase History
| Date | Buyer | Sale Price | Title Company |
|---|---|---|---|
| Holley Eric | -- | Stewart Title | |
| Ridder Michael | -- | Stewart Title Houston Div | |
| Crider Timothy L | -- | Stewart Title |
Source: Public Records
Mortgage History
| Date | Status | Borrower | Loan Amount |
|---|---|---|---|
| Open | Holley Eric | $120,000 | |
| Previous Owner | Ridder Michael | $92,000 | |
| Previous Owner | Crider Timothy L | $69,939 |
Source: Public Records
Tax History Compared to Growth
Tax History
| Year | Tax Paid | Tax Assessment Tax Assessment Total Assessment is a certain percentage of the fair market value that is determined by local assessors to be the total taxable value of land and additions on the property. | Land | Improvement |
|---|---|---|---|---|
| 2025 | $5,700 | $238,100 | $40,541 | $197,559 |
| 2024 | $5,700 | $244,385 | $40,541 | $203,844 |
| 2023 | $5,700 | $240,842 | $40,541 | $200,301 |
| 2022 | $5,862 | $234,962 | $34,082 | $200,880 |
| 2021 | $4,298 | $166,825 | $31,186 | $135,639 |
| 2020 | $4,401 | $163,365 | $24,503 | $138,862 |
| 2019 | $4,251 | $154,652 | $21,162 | $133,490 |
| 2018 | $1,923 | $143,520 | $16,038 | $127,482 |
| 2017 | $3,600 | $135,565 | $16,038 | $119,527 |
| 2016 | $3,273 | $129,126 | $16,038 | $113,088 |
| 2015 | $2,511 | $123,384 | $16,038 | $107,346 |
| 2014 | $2,511 | $105,703 | $16,038 | $89,665 |
Source: Public Records
Map
Nearby Homes
- 12046 Westlock Dr
- 11934 Westwold Dr
- 12107 Westwold Dr
- 11922 Westwold Dr
- 11831 Westlock Dr
- 12007 Northpointe Meadows Dr
- 11902 Oakner Dr
- 12226 Westwold Dr
- 12242 Westlock Dr
- 12222 Brighton Brook Ln
- 12331 Westwold Dr
- 17814 Winkler Willow Ct
- 18314 Westlock St
- 18135 Gravenhurst Ln
- 12022 Canyon Star Ln
- 12006 Canyon Star Ln
- 17826 Island Spring Ln
- 19010 Canyon Star Ct
- 18703 Summercliff Ln
- 12506 Opal Valley Dr
- 12030 Westwold Dr
- 12038 Westwold Dr
- 12026 Westwold Dr
- 12042 Westwold Dr
- 12043 Westlock Dr
- 12039 Westlock Dr
- 12047 Westlock Dr
- 12035 Westlock Dr
- 12022 Westwold Dr
- 12051 Westlock Dr
- 12031 Westwold Dr
- 12035 Westwold Dr
- 12027 Westwold Dr
- 12039 Westwold Dr
- 12027 Westlock Dr
- 12018 Westwold Dr
- 12023 Westwold Dr
- 12043 Westwold Dr
- 12019 Westwold Dr
- 12023 Westlock Dr