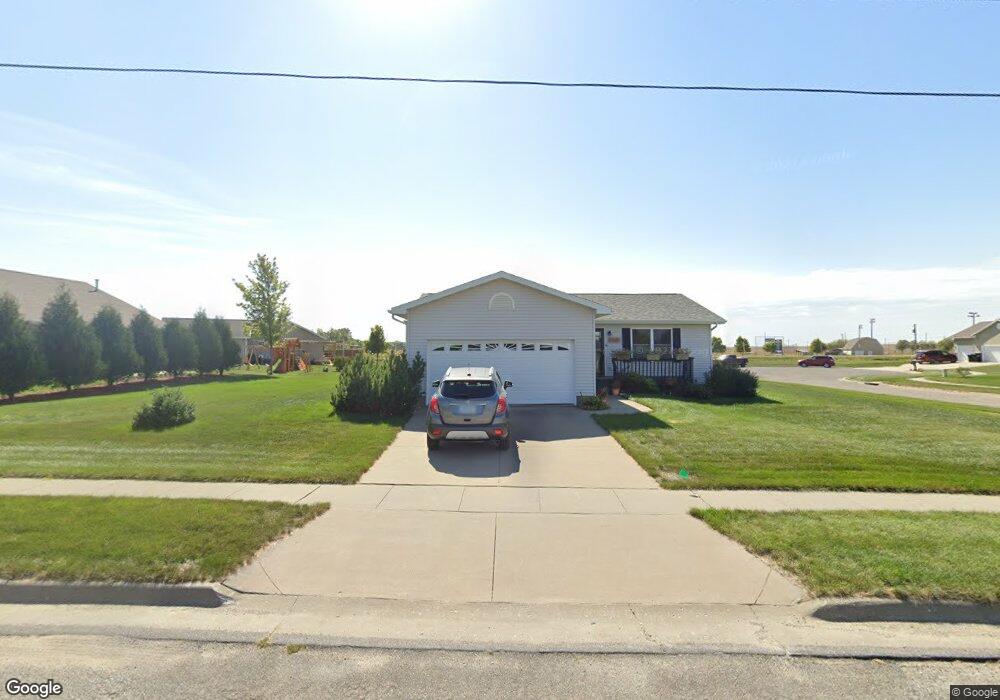
1204 E 16th St Vinton, IA 52349
Estimated Value: $244,000 - $437,000
4
Beds
3
Baths
2,060
Sq Ft
$147/Sq Ft
Est. Value
About This Home
This home is located at 1204 E 16th St, Vinton, IA 52349 and is currently estimated at $302,640, approximately $146 per square foot. 1204 E 16th St is a home located in Benton County with nearby schools including Tilford Elementary School, Vinton-Shellsburg Middle School, and Vinton-Shellsburg High School.
Ownership History
Date
Name
Owned For
Owner Type
Purchase Details
Closed on
Feb 12, 2009
Sold by
Hsbc Bank Usa
Bought by
Andrews Timothy M and Andrews Lori M
Current Estimated Value
Home Financials for this Owner
Home Financials are based on the most recent Mortgage that was taken out on this home.
Original Mortgage
$32,000
Outstanding Balance
$20,021
Interest Rate
4.91%
Mortgage Type
New Conventional
Estimated Equity
$282,619
Create a Home Valuation Report for This Property
The Home Valuation Report is an in-depth analysis detailing your home's value as well as a comparison with similar homes in the area
Home Values in the Area
Average Home Value in this Area
Purchase History
| Date | Buyer | Sale Price | Title Company |
|---|---|---|---|
| Andrews Timothy M | $112,000 | None Available |
Source: Public Records
Mortgage History
| Date | Status | Borrower | Loan Amount |
|---|---|---|---|
| Open | Andrews Timothy M | $32,000 |
Source: Public Records
Tax History
| Year | Tax Paid | Tax Assessment Tax Assessment Total Assessment is a certain percentage of the fair market value that is determined by local assessors to be the total taxable value of land and additions on the property. | Land | Improvement |
|---|---|---|---|---|
| 2025 | $3,586 | $225,800 | $35,800 | $190,000 |
| 2024 | $3,586 | $210,000 | $34,900 | $175,100 |
| 2023 | $3,470 | $210,000 | $34,900 | $175,100 |
| 2022 | $3,560 | $173,500 | $27,900 | $145,600 |
| 2021 | $3,560 | $173,500 | $27,900 | $145,600 |
| 2020 | $2,874 | $145,000 | $18,100 | $126,900 |
| 2019 | $2,872 | $145,000 | $18,100 | $126,900 |
| 2018 | $2,784 | $142,800 | $17,300 | $125,500 |
| 2017 | $2,784 | $142,800 | $17,300 | $125,500 |
| 2016 | $2,638 | $134,300 | $16,200 | $118,100 |
| 2015 | $2,638 | $134,300 | $16,200 | $118,100 |
| 2014 | $2,490 | $127,200 | $0 | $0 |
Source: Public Records
Map
Nearby Homes
Your Personal Tour Guide
Ask me questions while you tour the home.