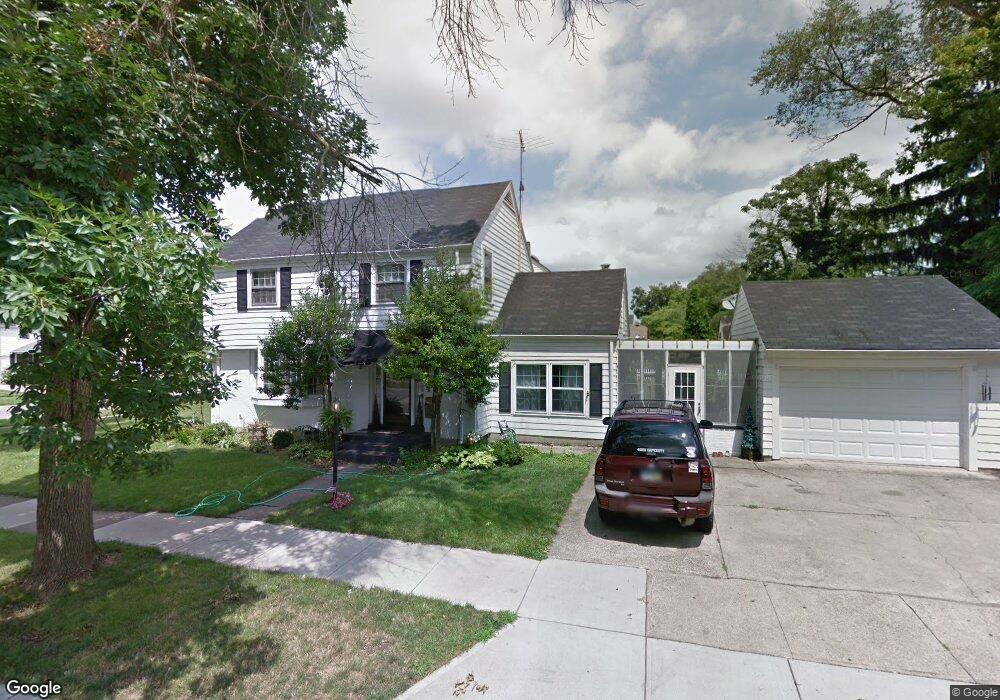
1204 Haldimand Ave Hamilton, OH 45013
Estimated Value: $263,965 - $293,000
4
Beds
3
Baths
2,082
Sq Ft
$133/Sq Ft
Est. Value
About This Home
This home is located at 1204 Haldimand Ave, Hamilton, OH 45013 and is currently estimated at $276,741, approximately $132 per square foot. 1204 Haldimand Ave is a home located in Butler County with nearby schools including Highland Elementary School, Wilson Middle School, and Hamilton High School Main Campus.
Ownership History
Date
Name
Owned For
Owner Type
Purchase Details
Closed on
Apr 6, 2018
Sold by
Mahon Nicki J and Maus Mark A
Bought by
Keene Mellissa L and Keene Kevin C
Current Estimated Value
Home Financials for this Owner
Home Financials are based on the most recent Mortgage that was taken out on this home.
Original Mortgage
$67,155
Outstanding Balance
$57,739
Interest Rate
4.43%
Mortgage Type
FHA
Estimated Equity
$219,002
Purchase Details
Closed on
Mar 7, 2014
Sold by
Lighthouse Investment Properties Llc
Bought by
Sambhi Nirmal Singh
Home Financials for this Owner
Home Financials are based on the most recent Mortgage that was taken out on this home.
Original Mortgage
$40,000
Interest Rate
4.35%
Mortgage Type
New Conventional
Purchase Details
Closed on
Aug 15, 2005
Sold by
Maus Nick L and Maus Joyce A
Bought by
Maus Nick L and Maus Joyce A
Create a Home Valuation Report for This Property
The Home Valuation Report is an in-depth analysis detailing your home's value as well as a comparison with similar homes in the area
Home Values in the Area
Average Home Value in this Area
Purchase History
| Date | Buyer | Sale Price | Title Company |
|---|---|---|---|
| Keene Mellissa L | $45,000 | None Available | |
| Sambhi Nirmal Singh | $1,075,000 | None Available | |
| Maus Nick L | -- | -- |
Source: Public Records
Mortgage History
| Date | Status | Borrower | Loan Amount |
|---|---|---|---|
| Open | Keene Mellissa L | $67,155 | |
| Closed | Sambhi Nirmal Singh | $40,000 |
Source: Public Records
Tax History Compared to Growth
Tax History
| Year | Tax Paid | Tax Assessment Tax Assessment Total Assessment is a certain percentage of the fair market value that is determined by local assessors to be the total taxable value of land and additions on the property. | Land | Improvement |
|---|---|---|---|---|
| 2024 | $2,806 | $66,500 | $8,260 | $58,240 |
| 2023 | $2,793 | $66,500 | $8,260 | $58,240 |
| 2022 | $2,513 | $50,300 | $8,260 | $42,040 |
| 2021 | $2,197 | $48,520 | $8,260 | $40,260 |
| 2020 | $2,289 | $48,520 | $8,260 | $40,260 |
| 2019 | $3,266 | $44,600 | $9,140 | $35,460 |
| 2018 | $2,132 | $44,600 | $9,140 | $35,460 |
| 2017 | $2,150 | $44,600 | $9,140 | $35,460 |
| 2016 | $2,898 | $40,400 | $9,140 | $31,260 |
| 2015 | $2,033 | $40,400 | $9,140 | $31,260 |
| 2014 | $8,812 | $40,400 | $9,140 | $31,260 |
| 2013 | $8,812 | $39,210 | $9,140 | $30,070 |
Source: Public Records
Map
Nearby Homes
- 1607 Cereal Ave
- 1263 Park Ave
- 900 N Lawn Ave
- 500 Marcia Ave
- 1028 Ross Ave
- 1421 Helma Ave
- 834 Ross Ave
- 306 N Dick Ave
- 1317 Glenbrook Dr
- 1038 Hunt Ave
- 814 Franklin St
- 420 Sherman Ave
- 12 Mitchell Ave
- 1150 Franklin St
- 231 Sherman Ave
- 639 S Mckinley Ave
- 714 Franklin St
- 226 Sherman Ave
- 197 Millville Ave
- 1231 Franklin St