Estimated Value: $2,076,000 - $2,687,000
2
Beds
2
Baths
2,467
Sq Ft
$924/Sq Ft
Est. Value
About This Home
This home is located at 1204 Monticello Rd, Napa, CA 94558 and is currently estimated at $2,280,514, approximately $924 per square foot. 1204 Monticello Rd is a home located in Napa County with nearby schools including Vichy Elementary School, Silverado Middle School, and Vintage High School.
Ownership History
Date
Name
Owned For
Owner Type
Purchase Details
Closed on
Aug 12, 2025
Sold by
Devincenzi David
Bought by
David And Patricia De Vincenzi Family Trust and Vincenzi De
Current Estimated Value
Purchase Details
Closed on
Jun 26, 2025
Sold by
Dominic And Barbara De Vincenzi Family T and Unger Mark
Bought by
Devincenzi David
Purchase Details
Closed on
Oct 9, 2019
Sold by
Devincenzi Barbara J
Bought by
Devincenzi Barbara J
Purchase Details
Closed on
Jan 6, 2003
Sold by
Devincenzi Dominic and Devincenzi Barbara
Bought by
Devincenzi Dominic A and Devincenzi Barbara J
Purchase Details
Closed on
Mar 24, 1999
Sold by
Devincenzi and Barbara
Bought by
Devincenzi Dominic and Devincenzi Barbara
Home Financials for this Owner
Home Financials are based on the most recent Mortgage that was taken out on this home.
Original Mortgage
$101,000
Interest Rate
6.73%
Create a Home Valuation Report for This Property
The Home Valuation Report is an in-depth analysis detailing your home's value as well as a comparison with similar homes in the area
Home Values in the Area
Average Home Value in this Area
Purchase History
| Date | Buyer | Sale Price | Title Company |
|---|---|---|---|
| David And Patricia De Vincenzi Family Trust | -- | None Listed On Document | |
| Devincenzi David | -- | None Listed On Document | |
| Devincenzi Barbara J | -- | None Available | |
| Devincenzi Dominic A | -- | -- | |
| Devincenzi Dominic | -- | Placer Title Company |
Source: Public Records
Mortgage History
| Date | Status | Borrower | Loan Amount |
|---|---|---|---|
| Previous Owner | Devincenzi Dominic | $101,000 |
Source: Public Records
Tax History Compared to Growth
Tax History
| Year | Tax Paid | Tax Assessment Tax Assessment Total Assessment is a certain percentage of the fair market value that is determined by local assessors to be the total taxable value of land and additions on the property. | Land | Improvement |
|---|---|---|---|---|
| 2025 | $18,293 | $1,699,435 | $1,283,276 | $416,159 |
| 2024 | $18,293 | $1,666,114 | $1,258,114 | $408,000 |
| 2023 | $18,293 | $1,633,446 | $1,233,446 | $400,000 |
| 2022 | $10,449 | $937,099 | $433,402 | $503,697 |
| 2021 | $10,288 | $918,726 | $424,904 | $493,822 |
| 2020 | $10,208 | $909,307 | $420,548 | $488,759 |
| 2019 | $10,136 | $902,281 | $412,302 | $489,979 |
| 2018 | $8,767 | $770,999 | $404,218 | $366,781 |
| 2017 | $8,623 | $755,883 | $396,293 | $359,590 |
| 2016 | $8,319 | $721,984 | $388,523 | $333,461 |
| 2015 | $7,008 | $635,297 | $382,688 | $252,609 |
| 2014 | $6,913 | $622,853 | $375,192 | $247,661 |
Source: Public Records
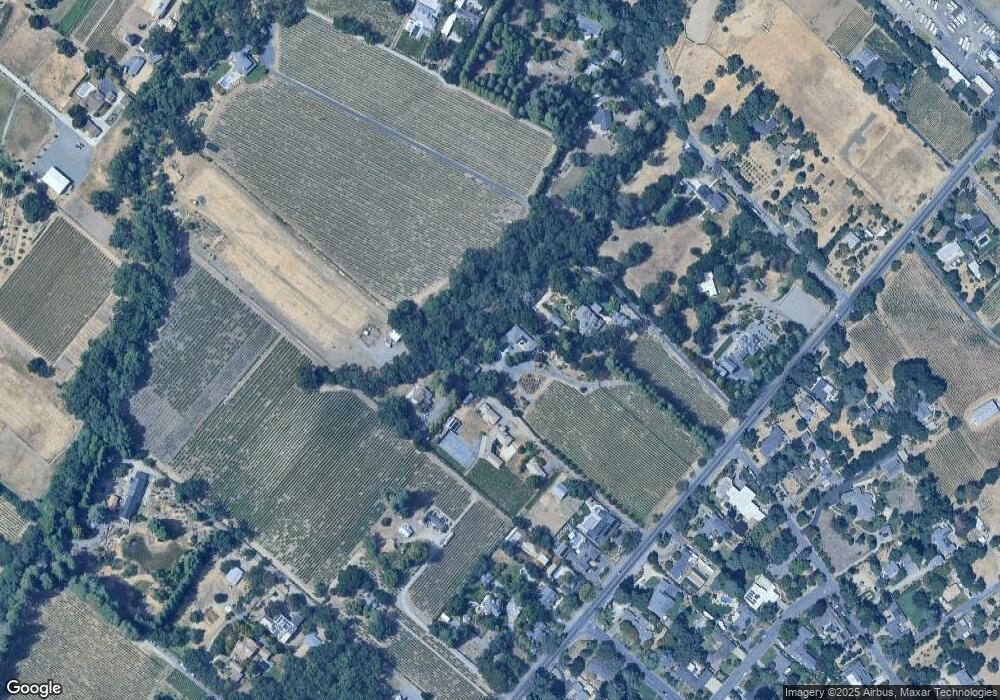
Map
Nearby Homes
- 1180 Monticello Rd
- 1079 Hedgeside Ave
- 1101 Hedgeside Ave
- 1776 Monticello Rd
- 1777 Mckinley Rd
- 2015 Monticello Rd
- 2863 Atlas Peak Rd
- 1095 Hardman Ave
- 1597 Estee Ave
- 265 Kaanapali Dr
- 2134 Monticello Rd
- 2143 Monticello Rd
- 6 Old Coach Rd
- 2152 Monticello Rd
- 1057 La Grande Ave
- 1600 Atlas Peak Rd Unit 432
- 1600 Atlas Peak Rd Unit 428
- 1600 Atlas Peak Rd Unit 365
- 2297 1st Ave
- 2186 Monticello Rd
- 1196 Monticello Rd
- 1192 Monticello Rd
- 1190 Monticello Rd
- 1007 Hedgeside Ave
- 1188 Monticello Rd
- 1033 Hedgeside Ave
- 1023 Hedgeside Ave
- 1186 Monticello Rd
- 1176 Monticello Rd
- 1174 Monticello Rd
- 1001 Bell Ln
- 1197 Monticello Rd
- 1215 Monticello Rd
- 1195 Monticello Rd
- 1193 Monticello Rd
- 1247 Monticello Rd
- 1249 Monticello Rd
- 1014 Hedgeside Ave
- 1020 Hedgeside Ave
- 1251 Monticello Rd