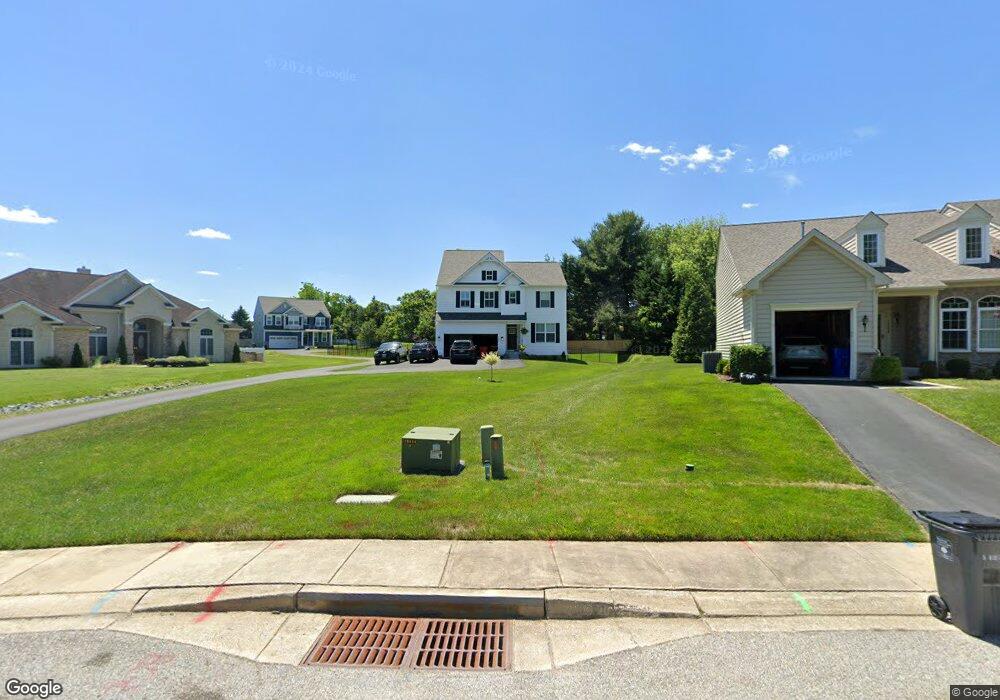
1204 Tuscany Ln Bel Air, MD 21014
Estimated Value: $525,000 - $684,000
2
Beds
2
Baths
1,950
Sq Ft
$313/Sq Ft
Est. Value
About This Home
This home is located at 1204 Tuscany Ln, Bel Air, MD 21014 and is currently estimated at $609,928, approximately $312 per square foot. 1204 Tuscany Ln is a home located in Harford County with nearby schools including Red Pump Elementary School, Fallston Middle School, and Fallston High School.
Ownership History
Date
Name
Owned For
Owner Type
Purchase Details
Closed on
Jun 7, 2022
Sold by
Bob Ward Trademark Homes Llc
Bought by
Maher Patrick William and Maher Taylor Ryan
Current Estimated Value
Home Financials for this Owner
Home Financials are based on the most recent Mortgage that was taken out on this home.
Original Mortgage
$542,080
Outstanding Balance
$515,435
Interest Rate
4.88%
Mortgage Type
Construction
Estimated Equity
$94,493
Purchase Details
Closed on
May 18, 2021
Sold by
Lancaster Lorraine M and Lancaster David G
Bought by
Bob Ward Trademark Homes Llc
Purchase Details
Closed on
May 17, 2018
Sold by
Lancaster James G and Lancaster Lorraine M
Bought by
Lancaster Lorraine M and Lancaster David G
Purchase Details
Closed on
Dec 3, 2008
Sold by
Lancaster James G
Bought by
Lancaster James G and Lancaster Lorraine M
Create a Home Valuation Report for This Property
The Home Valuation Report is an in-depth analysis detailing your home's value as well as a comparison with similar homes in the area
Home Values in the Area
Average Home Value in this Area
Purchase History
| Date | Buyer | Sale Price | Title Company |
|---|---|---|---|
| Maher Patrick William | $225,000 | New Title Company Name | |
| Maher Patrick William | $225,000 | New Title Company Name | |
| Bob Ward Trademark Homes Llc | $471,000 | Residential T&E Co | |
| Lancaster Lorraine M | -- | None Available | |
| Lancaster James G | -- | -- |
Source: Public Records
Mortgage History
| Date | Status | Borrower | Loan Amount |
|---|---|---|---|
| Open | Maher Patrick William | $542,080 | |
| Closed | Maher Patrick William | $542,080 |
Source: Public Records
Tax History Compared to Growth
Tax History
| Year | Tax Paid | Tax Assessment Tax Assessment Total Assessment is a certain percentage of the fair market value that is determined by local assessors to be the total taxable value of land and additions on the property. | Land | Improvement |
|---|---|---|---|---|
| 2025 | $5,474 | $532,600 | $119,100 | $413,500 |
| 2024 | $5,474 | $502,267 | $0 | $0 |
| 2023 | $5,144 | $471,933 | $0 | $0 |
| 2022 | $1,102 | $101,100 | $101,100 | $0 |
| 2021 | $0 | $98,200 | $0 | $0 |
| 2020 | $1,100 | $95,300 | $0 | $0 |
| 2019 | $1,066 | $92,400 | $92,400 | $0 |
| 2018 | $1,194 | $92,400 | $92,400 | $0 |
| 2017 | $1,182 | $92,400 | $0 | $0 |
| 2016 | -- | $103,400 | $0 | $0 |
| 2015 | $1,297 | $103,400 | $0 | $0 |
| 2014 | $1,297 | $103,400 | $0 | $0 |
Source: Public Records
Map
Nearby Homes
- 902 Shephard Ct
- 817 Peppard Dr
- 904 Martell Ct Unit E
- 1322 Locust Ave
- 903 Garland Ct
- 1004 Downing Ct Unit 16
- 1004 Bogart Cir
- 1346 Vanderbilt Rd
- 222 Steed Ln
- 1353 Sweetbriar Ln
- 1516 Cedarwood Dr
- 400 Birchwood Manor Ln
- 752 Roland Ave
- 747 Roland Ave
- 1208 Saint Francis Rd
- 1217 Grafton Shop Rd
- 916 Creek Park Rd
- 202 Princeton Ln
- 636 Wallingford Rd Unit 2H
- 636 Wallingford Rd Unit 2C
- 1202 Tuscany Ln
- 1200 Tuscany Ln
- 1202 Tuscany Ln
- 1216 Tuscany Ln
- 702 Cagney Ct
- 701 Cagney Ct
- 1220 Tuscany Ln
- 701 E Farrow Ct
- 703 E Farrow Ct
- 1222 Tuscany Ln
- 703 Cagney Ct
- 704 Cagney Ct
- 1192 Tuscany Ln
- 1224 Tuscany Ln
- 705 E Farrow Ct
- 700 E Farrow Ct
- 705 Cagney Ct
- 813 Brentwood Park Dr
- 815 Brentwood Park Dr
- 1226 Tuscany Ln