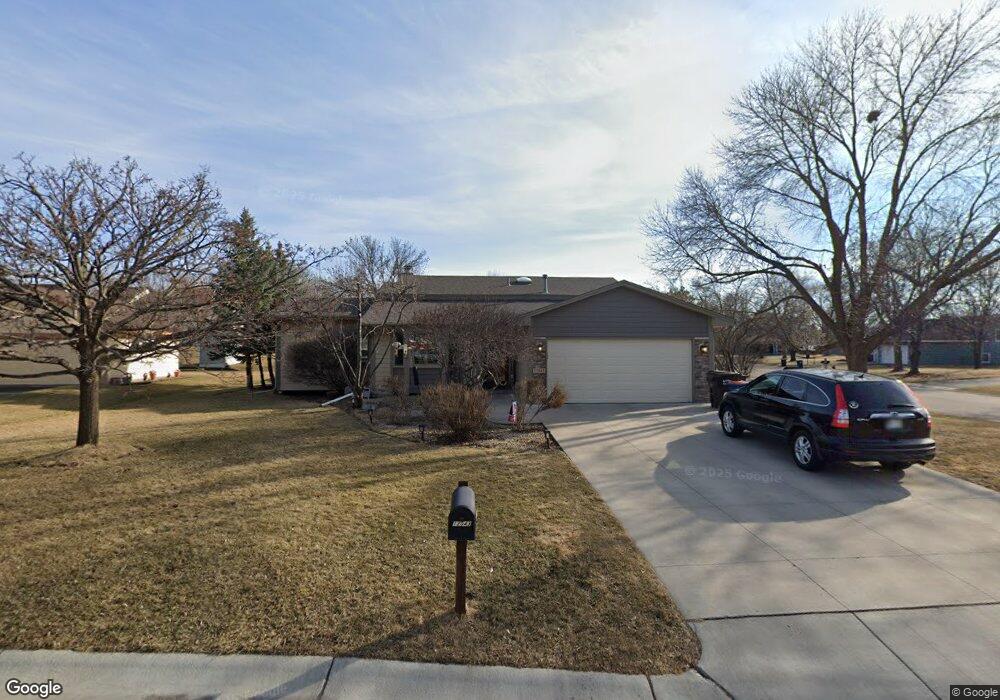
12043 88th Ave N Maple Grove, MN 55369
Estimated Value: $371,000 - $433,000
3
Beds
2
Baths
1,048
Sq Ft
$382/Sq Ft
Est. Value
About This Home
This home is located at 12043 88th Ave N, Maple Grove, MN 55369 and is currently estimated at $400,674, approximately $382 per square foot. 12043 88th Ave N is a home located in Hennepin County with nearby schools including Rice Lake Elementary School, Maple Grove Middle School, and Maple Grove Senior High School.
Ownership History
Date
Name
Owned For
Owner Type
Purchase Details
Closed on
Mar 11, 2020
Sold by
Burgard Jonathon P and Burgard Kristen E
Bought by
Burgard Jonathon P and Burgard Kristen E
Current Estimated Value
Purchase Details
Closed on
May 15, 2014
Sold by
Goodrich Sheffield S and Nakai Andrea C
Bought by
Burgard Jonathon P and Burgard Kristen E
Home Financials for this Owner
Home Financials are based on the most recent Mortgage that was taken out on this home.
Original Mortgage
$213,750
Interest Rate
4.41%
Mortgage Type
New Conventional
Purchase Details
Closed on
Jul 27, 2012
Sold by
Carlson Leonard L and Carlson Paula M
Bought by
Goodrich Sheffield S and Nakai Andrea C
Home Financials for this Owner
Home Financials are based on the most recent Mortgage that was taken out on this home.
Original Mortgage
$217,438
Interest Rate
3.25%
Mortgage Type
FHA
Create a Home Valuation Report for This Property
The Home Valuation Report is an in-depth analysis detailing your home's value as well as a comparison with similar homes in the area
Home Values in the Area
Average Home Value in this Area
Purchase History
| Date | Buyer | Sale Price | Title Company |
|---|---|---|---|
| Burgard Jonathon P | -- | None Listed On Document | |
| Burgard Jonathon P | $225,000 | Booth Title Group Llc | |
| Goodrich Sheffield S | $221,452 | Edina Realty Title Inc |
Source: Public Records
Mortgage History
| Date | Status | Borrower | Loan Amount |
|---|---|---|---|
| Previous Owner | Burgard Jonathon P | $213,750 | |
| Previous Owner | Goodrich Sheffield S | $217,438 |
Source: Public Records
Tax History Compared to Growth
Tax History
| Year | Tax Paid | Tax Assessment Tax Assessment Total Assessment is a certain percentage of the fair market value that is determined by local assessors to be the total taxable value of land and additions on the property. | Land | Improvement |
|---|---|---|---|---|
| 2024 | $4,004 | $341,900 | $88,600 | $253,300 |
| 2023 | $4,289 | $368,800 | $110,200 | $258,600 |
| 2022 | $3,611 | $380,300 | $111,500 | $268,800 |
| 2021 | $3,482 | $305,000 | $75,400 | $229,600 |
| 2020 | $3,542 | $289,500 | $73,900 | $215,600 |
| 2019 | $3,538 | $282,100 | $73,900 | $208,200 |
| 2018 | $3,188 | $267,400 | $72,900 | $194,500 |
| 2017 | $3,331 | $240,300 | $72,000 | $168,300 |
| 2016 | $3,135 | $224,800 | $70,000 | $154,800 |
| 2015 | $3,120 | $218,300 | $68,000 | $150,300 |
| 2014 | -- | $203,500 | $67,000 | $136,500 |
Source: Public Records
Map
Nearby Homes
- 11760 88th Place N
- 12509 88th Ave N
- 11879 85th Place N Unit 54
- 9058 Goldenrod Ln N
- 9146 Ives Ln N
- 9132 Kirkwood Ln N
- 8864 Cottonwood Ln N
- 12769 88th Ave N
- 8704 Cottonwood Ln N
- 8764 Cottonwood Ln N
- 8712 Cottonwood Ln N
- 12599 91st Place N
- 12598 84th Place N
- 8735 Rosewood Ln N
- 9201 Forestview Ln N
- 8949 Rosewood Ln N
- 11712 84th Ave N Unit 309
- 11858 84th Ave N
- 9311 Kirkwood Ln N
- 8399 Norwood Ln N
- 12043 12043 88th-Avenue-n
- 12015 88th Ave N
- 12072 87th Place N
- 12034 87th Place N
- 8810 Jonquil Ln N
- 11997 88th Ave N
- 8785 Jonquil Ln N
- 12006 87th Place N
- 8797 Jonquil Ln N
- 8809 Jonquil Ln N
- 8773 Jonquil Ln N
- 11984 88th Ave N
- 11973 88th Ave N
- 8822 Jonquil Ln N
- 11998 87th Place N
- 12150 87th Place N
- 11972 88th Ave N
- 12073 87th Place N
- 8833 Jonquil Ln N
- 8834 Jonquil Ln N