Estimated Value: $248,027 - $304,000
--
Bed
--
Bath
1,421
Sq Ft
$187/Sq Ft
Est. Value
About This Home
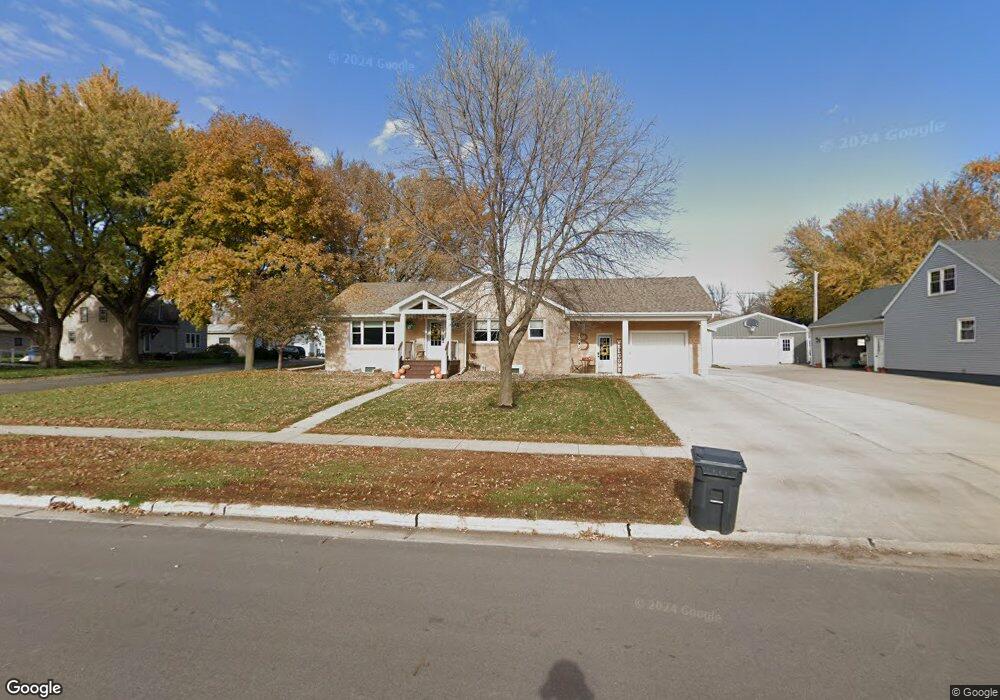
This home is located at 1205 1st St, Hull, IA 51239 and is currently estimated at $265,507, approximately $186 per square foot. 1205 1st St is a home located in Sioux County with nearby schools including Boyden-Hull Elementary School, Boyden-Hull High School, and Hull Christian School.
Ownership History
Date
Name
Owned For
Owner Type
Purchase Details
Closed on
Mar 16, 2018
Sold by
Beukelman Bradley A and Beukelman Kayti A
Bought by
Beukelman Bradley A and Beukelman Kayti A
Current Estimated Value
Home Financials for this Owner
Home Financials are based on the most recent Mortgage that was taken out on this home.
Original Mortgage
$147,500
Outstanding Balance
$106,541
Interest Rate
4.38%
Mortgage Type
New Conventional
Estimated Equity
$158,966
Purchase Details
Closed on
Apr 12, 2011
Sold by
Verhoef Craig A and Verhoef Teresa J
Bought by
Noteboom Kayti
Create a Home Valuation Report for This Property
The Home Valuation Report is an in-depth analysis detailing your home's value as well as a comparison with similar homes in the area
Home Values in the Area
Average Home Value in this Area
Purchase History
| Date | Buyer | Sale Price | Title Company |
|---|---|---|---|
| Beukelman Bradley A | -- | -- | |
| Noteboom Kayti | $155,000 | None Available |
Source: Public Records
Mortgage History
| Date | Status | Borrower | Loan Amount |
|---|---|---|---|
| Open | Beukelman Bradley A | $147,500 |
Source: Public Records
Tax History Compared to Growth
Tax History
| Year | Tax Paid | Tax Assessment Tax Assessment Total Assessment is a certain percentage of the fair market value that is determined by local assessors to be the total taxable value of land and additions on the property. | Land | Improvement |
|---|---|---|---|---|
| 2025 | $3,112 | $254,120 | $22,950 | $231,170 |
| 2024 | $3,112 | $215,200 | $22,950 | $192,250 |
| 2023 | $3,064 | $215,200 | $22,950 | $192,250 |
| 2022 | $2,810 | $171,620 | $22,950 | $148,670 |
| 2021 | $2,662 | $171,610 | $22,950 | $148,660 |
| 2020 | $2,662 | $155,100 | $22,950 | $132,150 |
| 2019 | $2,432 | $140,760 | $9,560 | $131,200 |
| 2018 | $2,480 | $140,760 | $9,560 | $131,200 |
| 2017 | $2,480 | $140,760 | $9,560 | $131,200 |
| 2014 | $2,000 | $116,280 | $0 | $0 |
Source: Public Records
Map
Nearby Homes