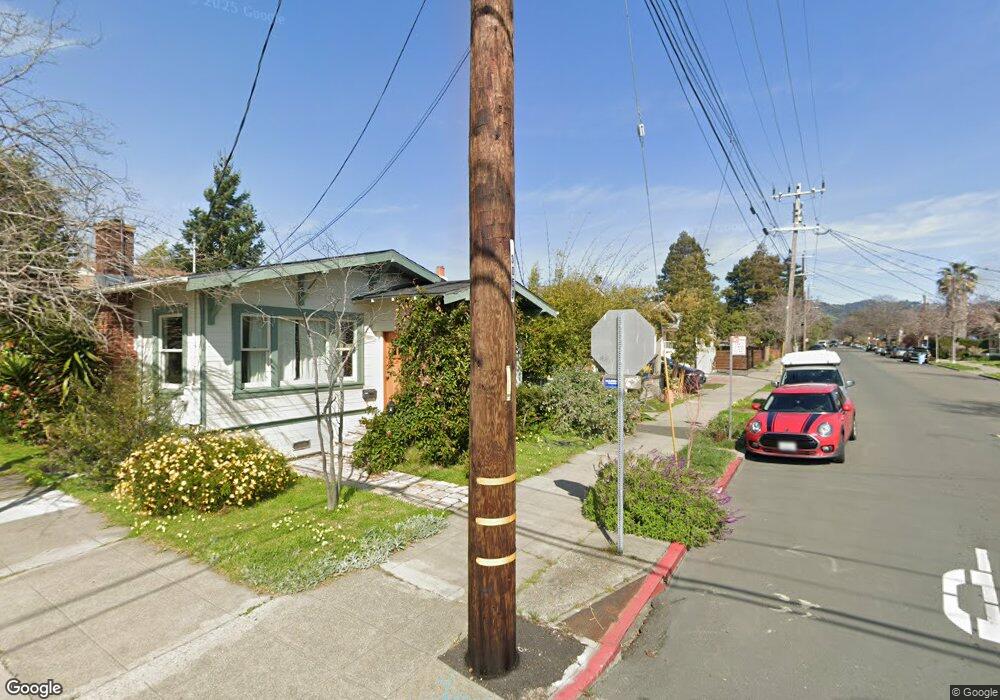
1205 Blake St Berkeley, CA 94702
West Berkeley NeighborhoodEstimated Value: $895,000 - $1,036,000
2
Beds
1
Bath
942
Sq Ft
$1,028/Sq Ft
Est. Value
About This Home
This home is located at 1205 Blake St, Berkeley, CA 94702 and is currently estimated at $968,624, approximately $1,028 per square foot. 1205 Blake St is a home located in Alameda County with nearby schools including Oxford Elementary School, Washington Elementary School, and Malcolm X Elementary School.
Ownership History
Date
Name
Owned For
Owner Type
Purchase Details
Closed on
Jun 15, 2010
Sold by
Chacin Susan and Garrett Ginny
Bought by
Chacin Susan and Garrett Ginny
Current Estimated Value
Home Financials for this Owner
Home Financials are based on the most recent Mortgage that was taken out on this home.
Original Mortgage
$129,500
Outstanding Balance
$42,523
Interest Rate
4.71%
Mortgage Type
New Conventional
Estimated Equity
$926,101
Purchase Details
Closed on
Jun 11, 1997
Sold by
Blosser Barbara N
Bought by
Chacin Susan and Garrett Ginny
Home Financials for this Owner
Home Financials are based on the most recent Mortgage that was taken out on this home.
Original Mortgage
$140,000
Interest Rate
7.94%
Create a Home Valuation Report for This Property
The Home Valuation Report is an in-depth analysis detailing your home's value as well as a comparison with similar homes in the area
Home Values in the Area
Average Home Value in this Area
Purchase History
| Date | Buyer | Sale Price | Title Company |
|---|---|---|---|
| Chacin Susan | -- | Fidelity National Title Co | |
| Chacin Susan | $175,000 | First American Title Guarant |
Source: Public Records
Mortgage History
| Date | Status | Borrower | Loan Amount |
|---|---|---|---|
| Open | Chacin Susan | $129,500 | |
| Closed | Chacin Susan | $140,000 |
Source: Public Records
Tax History Compared to Growth
Tax History
| Year | Tax Paid | Tax Assessment Tax Assessment Total Assessment is a certain percentage of the fair market value that is determined by local assessors to be the total taxable value of land and additions on the property. | Land | Improvement |
|---|---|---|---|---|
| 2025 | $5,955 | $278,002 | $85,500 | $199,502 |
| 2024 | $5,955 | $272,414 | $83,824 | $195,590 |
| 2023 | $5,760 | $273,937 | $82,181 | $191,756 |
| 2022 | $5,571 | $261,567 | $80,570 | $187,997 |
| 2021 | $5,564 | $256,301 | $78,990 | $184,311 |
| 2020 | $5,252 | $260,602 | $78,180 | $182,422 |
| 2019 | $5,016 | $255,494 | $76,648 | $178,846 |
| 2018 | $4,906 | $250,485 | $75,145 | $175,340 |
| 2017 | $4,706 | $245,575 | $73,672 | $171,903 |
| 2016 | $4,516 | $240,761 | $72,228 | $168,533 |
| 2015 | $4,442 | $237,145 | $71,143 | $166,002 |
| 2014 | $4,387 | $232,501 | $69,750 | $162,751 |
Source: Public Records
Map
Nearby Homes
- 1118 Dwight Way
- 2435 Bonar St
- 2703 Mathews St
- 2437 Acton St
- 1431 Dwight Way
- 1010 Grayson St
- 2413 7th St
- 2728 Dohr St
- 2304 Edwards St
- 1516 Blake St
- 1516 Blake St Unit A
- 1524 Blake St
- 1450 Ward St
- 2750 Sacramento St
- 2758 Sacramento St
- 2774 Sacramento St
- 2782 Sacramento St
- 2790 Sacramento St
- 2414 5th St
- 2220 7th St
- 1201 Blake St
- 1207 Blake St
- 2515 Mathews St
- 1211 Blake St
- 2511 Mathews St
- 1213 Blake St
- 2507 Mathews St
- 1206 Dwight Way
- 1208 Dwight Way
- 1204 Blake St
- 1200 Blake St
- 2516 Mathews St
- 1141 Blake St
- 2504 Mathews St
- 2512 Mathews St
- 1212 Dwight Way
- 1208 Blake St
- 1204 Dwight Way
- 1212 Blake St
- 1214 Dwight Way