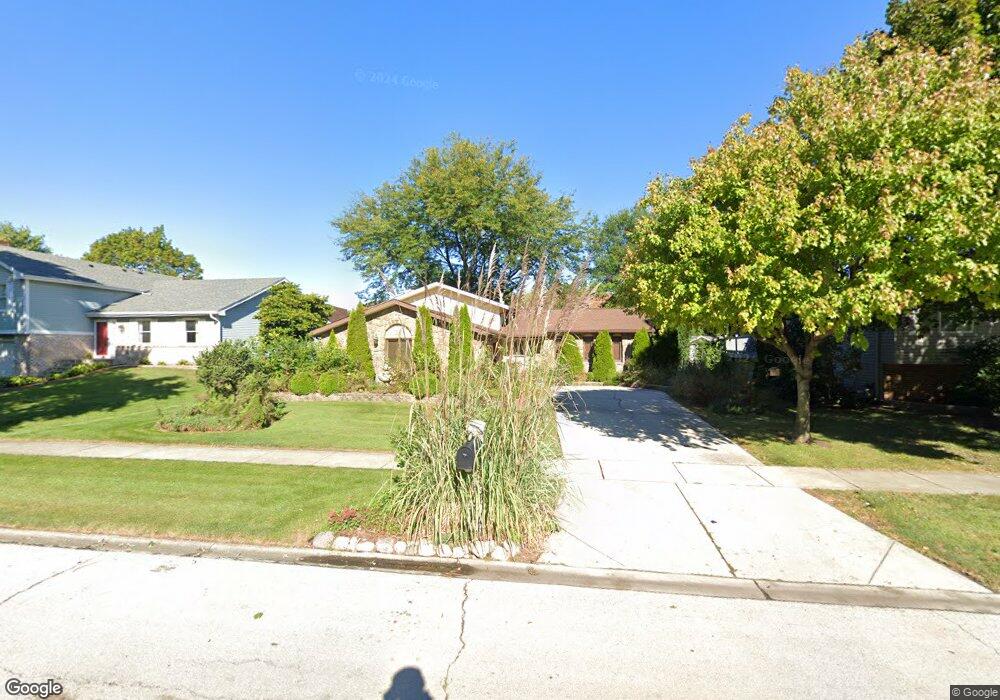
1205 Hidden Spring Dr Naperville, IL 60540
Brush Hill NeighborhoodEstimated Value: $477,468 - $611,000
--
Bed
--
Bath
1,428
Sq Ft
$373/Sq Ft
Est. Value
About This Home
This home is located at 1205 Hidden Spring Dr, Naperville, IL 60540 and is currently estimated at $533,117, approximately $373 per square foot. 1205 Hidden Spring Dr is a home located in DuPage County with nearby schools including Naper Elementary School, Washington Jr High School, and Naperville North High School.
Ownership History
Date
Name
Owned For
Owner Type
Purchase Details
Closed on
Oct 16, 1998
Sold by
Trafton Kevin
Bought by
Trafton Kevin and Trafton Laura
Current Estimated Value
Home Financials for this Owner
Home Financials are based on the most recent Mortgage that was taken out on this home.
Original Mortgage
$162,925
Outstanding Balance
$35,609
Interest Rate
6.88%
Estimated Equity
$497,508
Purchase Details
Closed on
Oct 10, 1998
Sold by
Hauser Frank J
Bought by
Trafton Kevin
Home Financials for this Owner
Home Financials are based on the most recent Mortgage that was taken out on this home.
Original Mortgage
$162,925
Outstanding Balance
$35,609
Interest Rate
6.88%
Estimated Equity
$497,508
Purchase Details
Closed on
Aug 16, 1994
Sold by
Norman David A and Norman Usha
Bought by
Hauser Frank J and Hauser Carol R
Home Financials for this Owner
Home Financials are based on the most recent Mortgage that was taken out on this home.
Original Mortgage
$108,500
Interest Rate
8.73%
Create a Home Valuation Report for This Property
The Home Valuation Report is an in-depth analysis detailing your home's value as well as a comparison with similar homes in the area
Home Values in the Area
Average Home Value in this Area
Purchase History
| Date | Buyer | Sale Price | Title Company |
|---|---|---|---|
| Trafton Kevin | -- | -- | |
| Trafton Kevin | $171,500 | -- | |
| Hauser Frank J | $158,500 | -- |
Source: Public Records
Mortgage History
| Date | Status | Borrower | Loan Amount |
|---|---|---|---|
| Open | Trafton Kevin | $162,925 | |
| Previous Owner | Hauser Frank J | $108,500 |
Source: Public Records
Tax History Compared to Growth
Tax History
| Year | Tax Paid | Tax Assessment Tax Assessment Total Assessment is a certain percentage of the fair market value that is determined by local assessors to be the total taxable value of land and additions on the property. | Land | Improvement |
|---|---|---|---|---|
| 2024 | $8,449 | $145,768 | $50,960 | $94,808 |
| 2023 | $7,979 | $130,980 | $45,790 | $85,190 |
| 2022 | $7,644 | $124,300 | $43,130 | $81,170 |
| 2021 | $7,371 | $119,860 | $41,590 | $78,270 |
| 2020 | $7,347 | $119,860 | $41,590 | $78,270 |
| 2019 | $7,080 | $114,000 | $39,560 | $74,440 |
| 2018 | $6,605 | $106,910 | $36,830 | $70,080 |
| 2017 | $6,465 | $103,280 | $35,580 | $67,700 |
| 2016 | $6,304 | $99,120 | $34,150 | $64,970 |
| 2015 | $6,305 | $94,110 | $32,420 | $61,690 |
| 2014 | $6,147 | $89,270 | $30,530 | $58,740 |
| 2013 | $6,105 | $89,890 | $30,740 | $59,150 |
Source: Public Records
Map
Nearby Homes
- 1212 Whispering Hills Ct Unit 2B
- 1215 Chalet Rd Unit 101
- 122 Encina Dr
- 1099 W Jefferson Ave
- 1041 W Ogden Ave Unit 320
- 134 S Whispering Hills Dr
- 1117 Summit Hills Ln
- 21 Forest Ave
- 319 Claremont Ct
- 417 River Bluff Cir
- 479 River Bend Rd Unit 111
- 1748 Windward Ave Unit 92
- 1125 Royal Saint George Dr Unit 208
- 511 Aurora Ave Unit 108
- 225 N Mill St
- 713 Burning Tree Ln
- 243 Box Car Ave
- 7S410 Arbor Dr
- 1432 Calcutta Ln
- 103 S Webster St
- 1207 Hidden Spring Dr
- 1203 Hidden Spring Dr
- 1139 Hidden Spring Dr
- 1209 Hidden Spring Dr
- 1208 Whispering Hills Ct Unit 1B
- 1208 Whispering Hills Ct Unit 2B
- 1208 Whispering Hills Ct Unit 2A
- 1208 Whispering Hills Ct Unit A1
- 1208 Whisprng Hlls Ct Unit 2B
- 1208 Whisprng Hlls Ct Unit 2A
- 1208 Whisprng Hlls Ct Unit 1A
- 1208 Whisprng Hlls Ct Unit 3A
- 1208 Whisprng Hlls Ct Unit 1B
- 1208 Whisprng Hlls Ct Unit 3B
- 1204 Hidden Spring Dr
- 1212 Whisprng Hlls Ct Unit 1A
- 1212 Whisprng Hlls Ct Unit 2A
- 1212 Whisprng Hlls Ct Unit 1B
- 1212 Whisprng Hlls Ct Unit 2B
- 1212 Whisprng Hlls Ct Unit 3B