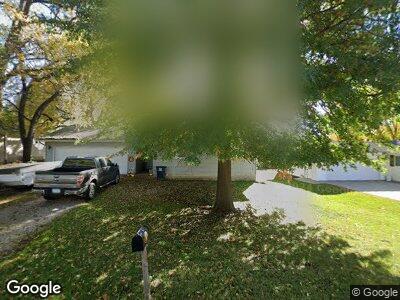
1205 Howard St Aplington, IA 50604
Estimated Value: $124,000 - $163,000
3
Beds
1
Bath
1,092
Sq Ft
$138/Sq Ft
Est. Value
About This Home
This home is located at 1205 Howard St, Aplington, IA 50604 and is currently estimated at $150,964, approximately $138 per square foot. 1205 Howard St is a home located in Butler County with nearby schools including Aplington Elementary School.
Create a Home Valuation Report for This Property
The Home Valuation Report is an in-depth analysis detailing your home's value as well as a comparison with similar homes in the area
Home Values in the Area
Average Home Value in this Area
Mortgage History
| Date | Status | Borrower | Loan Amount |
|---|---|---|---|
| Closed | Petersen Julie S | $44,000 | |
| Closed | Myers Julie S | $20,000 | |
| Closed | Petersen Dustan L | $49,600 | |
| Closed | Petersen Dustan L | $26,000 | |
| Closed | Petersen Julie S | $0 |
Source: Public Records
Tax History Compared to Growth
Tax History
| Year | Tax Paid | Tax Assessment Tax Assessment Total Assessment is a certain percentage of the fair market value that is determined by local assessors to be the total taxable value of land and additions on the property. | Land | Improvement |
|---|---|---|---|---|
| 2024 | $2,132 | $137,250 | $12,250 | $125,000 |
| 2023 | $2,058 | $137,250 | $12,250 | $125,000 |
| 2022 | $1,998 | $116,240 | $12,250 | $103,990 |
| 2021 | $1,932 | $116,240 | $12,250 | $103,990 |
| 2020 | $1,932 | $103,760 | $12,250 | $91,510 |
| 2019 | $1,766 | $95,450 | $0 | $0 |
| 2018 | $1,726 | $95,450 | $0 | $0 |
| 2017 | $1,726 | $95,450 | $0 | $0 |
| 2016 | $1,432 | $80,160 | $0 | $0 |
| 2015 | $1,432 | $80,160 | $0 | $0 |
| 2014 | $1,478 | $80,160 | $0 | $0 |
Source: Public Records