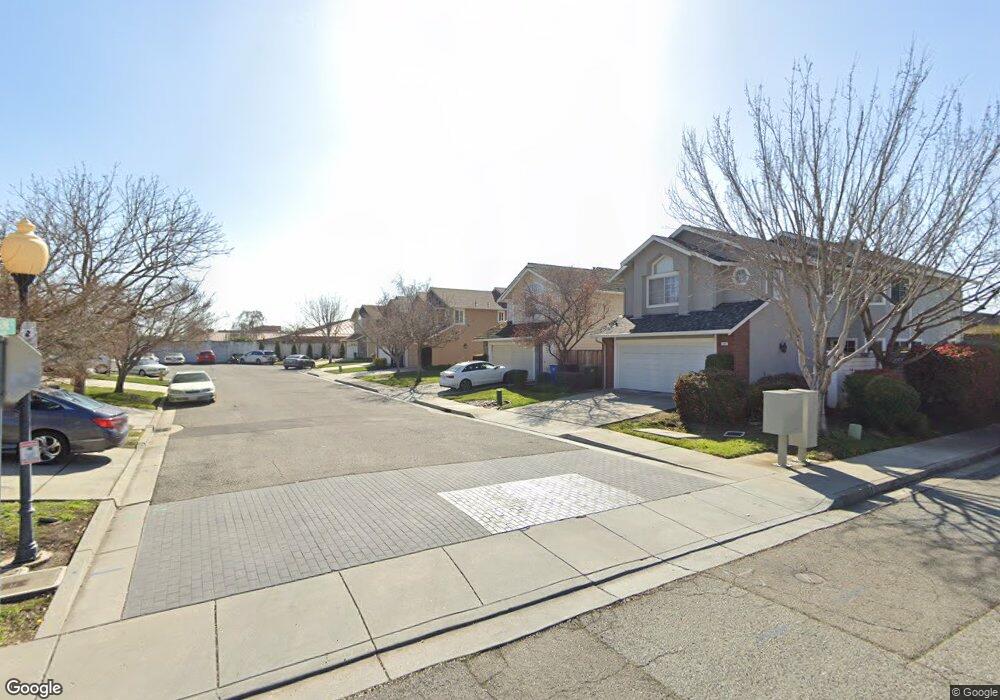
1205 Sassone Ct Milpitas, CA 95035
Estimated Value: $1,654,000 - $1,972,000
3
Beds
3
Baths
1,771
Sq Ft
$1,015/Sq Ft
Est. Value
About This Home
This home is located at 1205 Sassone Ct, Milpitas, CA 95035 and is currently estimated at $1,796,891, approximately $1,014 per square foot. 1205 Sassone Ct is a home located in Santa Clara County with nearby schools including John Sinnott Elementary School, Rancho Milpitas Middle School, and Milpitas High School.
Ownership History
Date
Name
Owned For
Owner Type
Purchase Details
Closed on
Apr 26, 2020
Sold by
Kamat Mahesh and Kamath Aruna
Bought by
Kamat Mahesh and Kamath Aruna
Current Estimated Value
Purchase Details
Closed on
Jan 4, 2008
Sold by
Katayama James M and Sun Min Fen
Bought by
Kamat Mahesh and Kamath Aruna
Home Financials for this Owner
Home Financials are based on the most recent Mortgage that was taken out on this home.
Original Mortgage
$552,000
Outstanding Balance
$345,517
Interest Rate
6%
Mortgage Type
Purchase Money Mortgage
Estimated Equity
$1,451,374
Purchase Details
Closed on
Jun 24, 1994
Sold by
Citicorp Mtg Corp
Bought by
Katayama James M and Sun Min Fen
Home Financials for this Owner
Home Financials are based on the most recent Mortgage that was taken out on this home.
Original Mortgage
$216,000
Interest Rate
5.37%
Create a Home Valuation Report for This Property
The Home Valuation Report is an in-depth analysis detailing your home's value as well as a comparison with similar homes in the area
Home Values in the Area
Average Home Value in this Area
Purchase History
| Date | Buyer | Sale Price | Title Company |
|---|---|---|---|
| Kamat Mahesh | -- | None Available | |
| Kamat Mahesh | $690,000 | First American Title Co | |
| Katayama James M | $245,000 | Stewart Title |
Source: Public Records
Mortgage History
| Date | Status | Borrower | Loan Amount |
|---|---|---|---|
| Open | Kamat Mahesh | $552,000 | |
| Previous Owner | Katayama James M | $216,000 |
Source: Public Records
Tax History
| Year | Tax Paid | Tax Assessment Tax Assessment Total Assessment is a certain percentage of the fair market value that is determined by local assessors to be the total taxable value of land and additions on the property. | Land | Improvement |
|---|---|---|---|---|
| 2025 | $10,344 | $906,315 | $498,474 | $407,841 |
| 2024 | $10,344 | $888,545 | $488,700 | $399,845 |
| 2023 | $10,311 | $871,123 | $479,118 | $392,005 |
| 2022 | $10,267 | $854,043 | $469,724 | $384,319 |
| 2021 | $10,117 | $837,298 | $460,514 | $376,784 |
| 2020 | $10,023 | $828,713 | $455,792 | $372,921 |
| 2019 | $9,909 | $812,464 | $446,855 | $365,609 |
| 2018 | $9,410 | $796,535 | $438,094 | $358,441 |
| 2017 | $9,289 | $780,917 | $429,504 | $351,413 |
| 2016 | $8,836 | $765,606 | $421,083 | $344,523 |
| 2015 | $8,745 | $754,106 | $414,758 | $339,348 |
| 2014 | $8,512 | $739,335 | $406,634 | $332,701 |
Source: Public Records
Map
Nearby Homes
- 1490 Mount Diablo Ave
- 2178 Ashwood Ln
- 1759 Tahoe Dr
- 2085 Ashwood Ln
- 2074 Ashwood Ln
- 1260 Glacier Dr
- 1394 Glacier Dr
- 3278 Sagewood Ln
- 2235 Skyline Dr
- 529 Bryce Ct
- 3647 Madrid Dr
- 861 Garden St
- 3659 Madrid Ct
- 3455 Sagewood Ln
- 484 Dempsey Rd Unit 186
- 792 Garden St
- 397 S Park Victoria Dr
- 496 Dempsey Rd Unit 199
- 3076 Baronscourt Way
- 320 Monmouth Dr
- 1207 Sassone Ct
- 1203 Sassone Ct
- 1201 Sassone Ct
- 1209 Sassone Ct
- 1204 Sassone Ct
- 1202 Sassone Ct
- 1206 Sassone Ct
- 1200 Sassone Ct
- 1208 Sassone Ct
- 1471 Big Basin Dr
- 1517 Big Basin Dr
- 1210 Sassone Ct
- 1475 Big Basin Dr
- 1513 Big Basin Dr
- 1479 Big Basin Dr
- 1566 Big Basin Dr
- 1509 Big Basin Dr
- 1457 Big Basin Dr
- 1483 Big Basin Dr
- 1453 Big Basin Dr
Your Personal Tour Guide
Ask me questions while you tour the home.