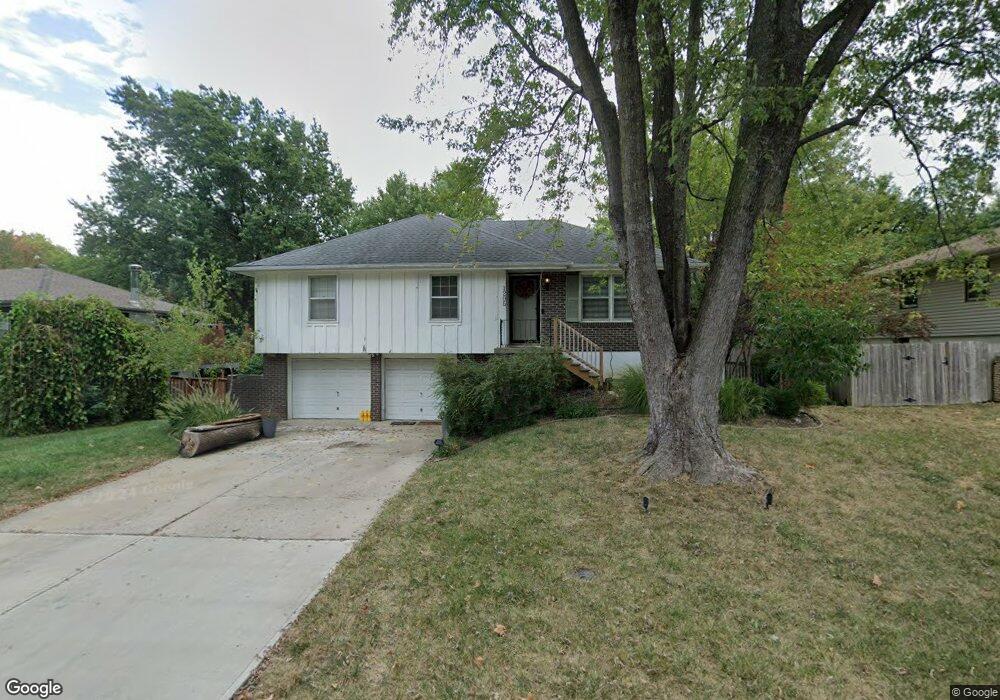
1205 SW Mission Place Lees Summit, MO 64081
Estimated Value: $255,000 - $277,000
3
Beds
2
Baths
1,056
Sq Ft
$253/Sq Ft
Est. Value
About This Home
This home is located at 1205 SW Mission Place, Lees Summit, MO 64081 and is currently estimated at $266,982, approximately $252 per square foot. 1205 SW Mission Place is a home located in Jackson County with nearby schools including Pleasant Lea Middle School, Lee's Summit Senior High School, and Summit Christian Academy.
Ownership History
Date
Name
Owned For
Owner Type
Purchase Details
Closed on
Jan 26, 2018
Sold by
Cook Justin L and Cook Clara A
Bought by
Cook Justin L and Cook Clara A
Current Estimated Value
Home Financials for this Owner
Home Financials are based on the most recent Mortgage that was taken out on this home.
Original Mortgage
$124,895
Outstanding Balance
$105,397
Interest Rate
3.94%
Mortgage Type
FHA
Estimated Equity
$161,585
Purchase Details
Closed on
Sep 11, 2008
Sold by
Rice Douglas L and Rice Barbara L
Bought by
Cook Justin L
Home Financials for this Owner
Home Financials are based on the most recent Mortgage that was taken out on this home.
Original Mortgage
$93,782
Interest Rate
6.54%
Mortgage Type
FHA
Create a Home Valuation Report for This Property
The Home Valuation Report is an in-depth analysis detailing your home's value as well as a comparison with similar homes in the area
Home Values in the Area
Average Home Value in this Area
Purchase History
| Date | Buyer | Sale Price | Title Company |
|---|---|---|---|
| Cook Justin L | -- | Truhome Title Solutions | |
| Cook Justin L | -- | Kansas City Title |
Source: Public Records
Mortgage History
| Date | Status | Borrower | Loan Amount |
|---|---|---|---|
| Open | Cook Justin L | $124,895 | |
| Closed | Cook Justin L | $93,782 |
Source: Public Records
Tax History Compared to Growth
Tax History
| Year | Tax Paid | Tax Assessment Tax Assessment Total Assessment is a certain percentage of the fair market value that is determined by local assessors to be the total taxable value of land and additions on the property. | Land | Improvement |
|---|---|---|---|---|
| 2025 | $2,999 | $37,189 | $7,066 | $30,123 |
| 2024 | $2,977 | $41,536 | $7,602 | $33,934 |
| 2023 | $2,977 | $41,536 | $5,951 | $35,585 |
| 2022 | $2,270 | $28,120 | $5,213 | $22,907 |
| 2021 | $2,317 | $28,120 | $5,213 | $22,907 |
| 2020 | $2,225 | $26,736 | $5,213 | $21,523 |
| 2019 | $2,164 | $26,736 | $5,213 | $21,523 |
| 2018 | $2,029 | $23,269 | $4,537 | $18,732 |
| 2017 | $2,029 | $23,269 | $4,537 | $18,732 |
| 2016 | $1,999 | $22,686 | $3,933 | $18,753 |
| 2014 | $1,989 | $22,125 | $3,679 | $18,446 |
Source: Public Records
Map
Nearby Homes
- 1412 SW Madison St
- 1019 SW Ingleside Place
- 411 SW Glendana St
- 1406 SW Jefferson St
- 1000 SW Lakeview Blvd
- 1501 SW Shelby Dr
- 226 SW Pinetree Ln
- 413 SW Highland St
- 1647 SW Highland Dr
- 1521 SW Hedgewood Ln
- 907 SW Lea Dr
- 403 SW Mission Rd
- 949 SW Daney Dr
- 1052 SW Twin Creek Dr
- 1608 SW Hedgewood Ln
- 701 SW Ward Rd
- 3053 NW Thoreau Ln
- 1123 SW Hoke Dr
- 1152 SW Pacific Cir
- 134 SW Robin Rd
- 1207 SW Mission Place
- 1203 SW Mission Place
- 1204 SW Mission Place
- 1202 SW Mission Place
- 1206 SW Mission Place
- 1209 SW Mission Place
- 1201 SW Mission Place
- 1208 SW Mission Place
- 505 SW Holloway Ln
- 1211 SW Mission Place
- 1111 SW Mission Place
- 1300 SW Mission Place
- 1301 SW Mission Place
- 507 SW Holloway Ln
- 1302 SW Mission Place
- 1205 SW Madison St
- 1109 SW Mission Place
- 1203 SW Madison St
- 504 SW Holloway Ln
- 506 SW Holloway Ln