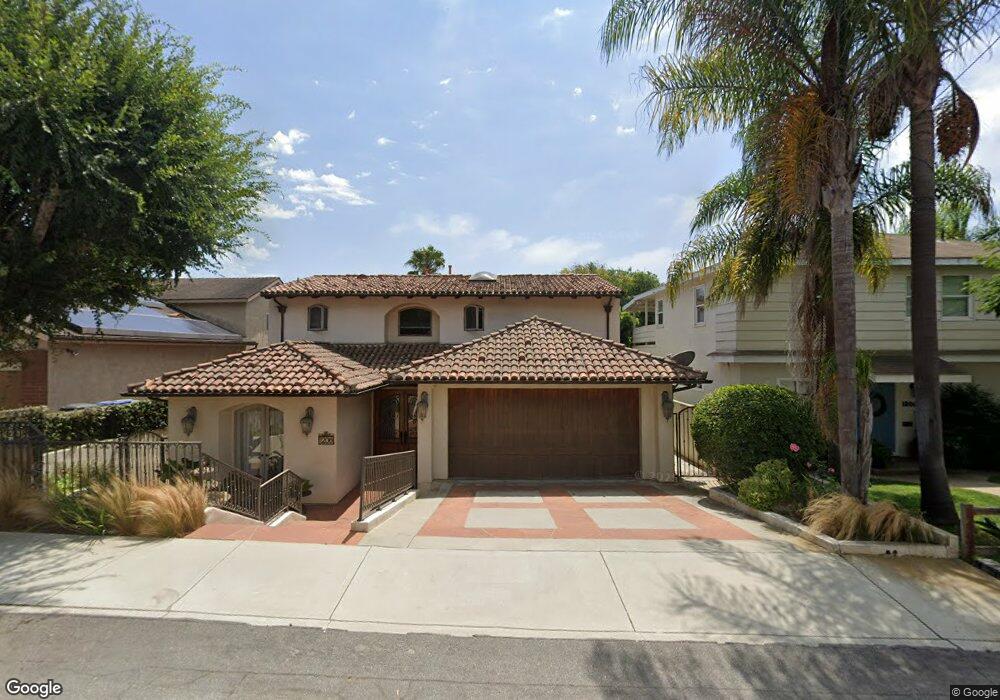
1206 3rd St Manhattan Beach, CA 90266
Estimated Value: $3,214,000 - $4,776,000
5
Beds
4
Baths
4,120
Sq Ft
$982/Sq Ft
Est. Value
About This Home
This home is located at 1206 3rd St, Manhattan Beach, CA 90266 and is currently estimated at $4,047,793, approximately $982 per square foot. 1206 3rd St is a home located in Los Angeles County with nearby schools including Aurelia Pennekamp Elementary School, Manhattan Beach Middle School, and Mira Costa High School.
Ownership History
Date
Name
Owned For
Owner Type
Purchase Details
Closed on
Jun 6, 2007
Sold by
El Sawy Omar A
Bought by
El Sawy Omar A and El Sawy Hana N
Current Estimated Value
Purchase Details
Closed on
Mar 2, 2001
Sold by
Brand Russell L
Bought by
Elsawy Omar A and Elsawy Hana N
Home Financials for this Owner
Home Financials are based on the most recent Mortgage that was taken out on this home.
Original Mortgage
$360,000
Interest Rate
7.75%
Purchase Details
Closed on
Mar 18, 1998
Sold by
Brand Russell L
Bought by
Brand Russell Lee and Carey Sherrie Lee
Home Financials for this Owner
Home Financials are based on the most recent Mortgage that was taken out on this home.
Original Mortgage
$328,000
Interest Rate
7.06%
Purchase Details
Closed on
Jun 28, 1994
Sold by
Robinson Morgan T
Bought by
Brand Russell Lee and Carey Sherrie Lee
Home Financials for this Owner
Home Financials are based on the most recent Mortgage that was taken out on this home.
Original Mortgage
$299,200
Interest Rate
8.38%
Create a Home Valuation Report for This Property
The Home Valuation Report is an in-depth analysis detailing your home's value as well as a comparison with similar homes in the area
Home Values in the Area
Average Home Value in this Area
Purchase History
| Date | Buyer | Sale Price | Title Company |
|---|---|---|---|
| El Sawy Omar A | -- | None Available | |
| Elsawy Omar A | $490,000 | Continental Title | |
| Brand Russell Lee | -- | South Coast Title | |
| Brand Russell Lee | $315,000 | Southland Title |
Source: Public Records
Mortgage History
| Date | Status | Borrower | Loan Amount |
|---|---|---|---|
| Previous Owner | Elsawy Omar A | $360,000 | |
| Previous Owner | Brand Russell Lee | $328,000 | |
| Previous Owner | Brand Russell Lee | $299,200 |
Source: Public Records
Tax History
| Year | Tax Paid | Tax Assessment Tax Assessment Total Assessment is a certain percentage of the fair market value that is determined by local assessors to be the total taxable value of land and additions on the property. | Land | Improvement |
|---|---|---|---|---|
| 2025 | $17,199 | $1,488,574 | $738,347 | $750,227 |
| 2024 | $17,199 | $1,459,387 | $723,870 | $735,517 |
| 2023 | $16,674 | $1,430,773 | $709,677 | $721,096 |
| 2022 | $16,390 | $1,402,719 | $695,762 | $706,957 |
| 2021 | $16,115 | $1,375,216 | $682,120 | $693,096 |
| 2020 | $15,967 | $1,361,116 | $675,126 | $685,990 |
| 2019 | $15,689 | $1,334,429 | $661,889 | $672,540 |
| 2018 | $15,332 | $1,308,264 | $648,911 | $659,353 |
| 2016 | $14,166 | $1,257,464 | $623,714 | $633,750 |
| 2015 | $13,875 | $1,238,577 | $614,346 | $624,231 |
| 2014 | $13,687 | $1,214,316 | $602,312 | $612,004 |
Source: Public Records
Map
Nearby Homes
- 1450 6th St
- 912 N Rowell Ave
- 449 S Prospect Ave
- 934 1st St
- 927 9th St
- 1416 Manhattan Beach Blvd
- 207 S Poinsettia Ave
- 1167 Magnolia Ave
- 1450 Manhattan Beach Blvd
- 626 Longfellow Ave
- 1612 Gates Ave
- 1643 3rd St
- 649 Gould Terrace
- 1659 3rd St
- 2919 Hermosa View Dr
- 2900 Hermosa View Dr
- 1411 15th St
- 1612 Magnolia Ave
- 541 4th St
- 2411 Prospect Ave Unit 214
Your Personal Tour Guide
Ask me questions while you tour the home.