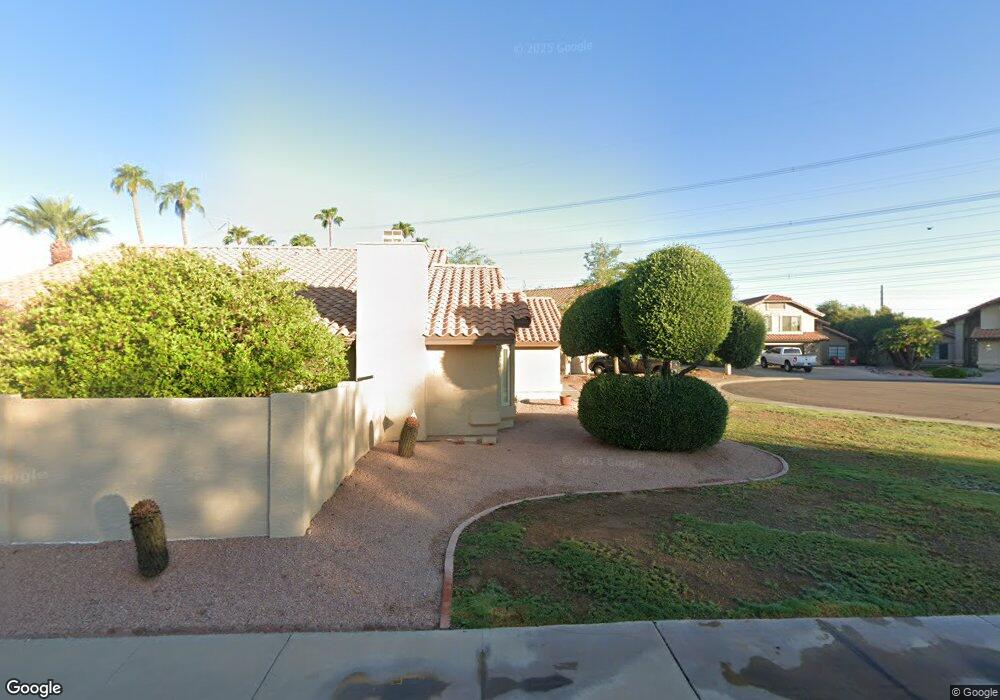
1206 E Divot Dr Tempe, AZ 85283
South Tempe NeighborhoodEstimated Value: $626,000 - $661,000
Studio
4
Baths
2,624
Sq Ft
$246/Sq Ft
Est. Value
About This Home
This home is located at 1206 E Divot Dr, Tempe, AZ 85283 and is currently estimated at $644,672, approximately $245 per square foot. 1206 E Divot Dr is a home located in Maricopa County with nearby schools including Kyrene de los Niños Elementary School, Kyrene del Norte School, and Kyrene Middle School.
Ownership History
Date
Name
Owned For
Owner Type
Purchase Details
Closed on
Oct 12, 2023
Sold by
King Bradley and King Victoria L
Bought by
King Family Trust and King
Current Estimated Value
Create a Home Valuation Report for This Property
The Home Valuation Report is an in-depth analysis detailing your home's value as well as a comparison with similar homes in the area
Home Values in the Area
Average Home Value in this Area
Purchase History
| Date | Buyer | Sale Price | Title Company |
|---|---|---|---|
| King Family Trust | -- | None Listed On Document |
Source: Public Records
Tax History
| Year | Tax Paid | Tax Assessment Tax Assessment Total Assessment is a certain percentage of the fair market value that is determined by local assessors to be the total taxable value of land and additions on the property. | Land | Improvement |
|---|---|---|---|---|
| 2025 | $3,868 | $40,977 | -- | -- |
| 2024 | $3,625 | $39,025 | -- | -- |
| 2023 | $3,625 | $52,150 | $10,430 | $41,720 |
| 2022 | $3,429 | $40,550 | $8,110 | $32,440 |
| 2021 | $3,557 | $37,610 | $7,520 | $30,090 |
| 2020 | $3,472 | $36,210 | $7,240 | $28,970 |
| 2019 | $3,362 | $34,800 | $6,960 | $27,840 |
| 2018 | $3,249 | $32,780 | $6,550 | $26,230 |
| 2017 | $3,115 | $31,200 | $6,240 | $24,960 |
| 2016 | $3,159 | $32,120 | $6,420 | $25,700 |
| 2015 | $2,918 | $29,110 | $5,820 | $23,290 |
Source: Public Records
Map
Nearby Homes
- 987 E Divot Dr
- 1011 E Redfield Rd
- 1032 E Redfield Rd
- 6833 S Jentilly Ln
- 1033 E Bendix Dr
- 1125 E Lodge Dr
- 6743 S Newberry Rd
- 6736 S Stanley Place
- 6801 S Palm Dr
- 831 E Divot Dr
- 920 E Mcnair Dr
- 738 E Strahan Dr
- 1070 E Sunburst Ln
- 1315 E Mcnair Dr
- 6815 S Juniper St
- 7716 S Rita Ln Unit 3
- 1231 E Sunburst Ln
- 1060 E Louis Way Unit 14
- 6556 S La Rosa Dr
- 758 E Sunburst Ln
- 1208 E Divot Dr
- 1204 E Divot Dr
- 994 E Divot Dr
- 996 E Divot Dr
- 1202 E Divot Dr
- 1210 E Divot Dr
- 1212 E Divot Dr
- 1200 E Divot Dr
- 998 E Divot Dr
- 992 E Divot Dr
- 1205 E Divot Dr
- 1203 E Divot Dr
- 1207 E Divot Dr
- 1214 E Divot Dr
- 1201 E Divot Dr
- 1201 E Divot Dr
- 990 E Divot Dr
- 1213 E Divot Dr
- 988 E Divot Dr
- 7203 S Bonarden Ln
Your Personal Tour Guide
Ask me questions while you tour the home.