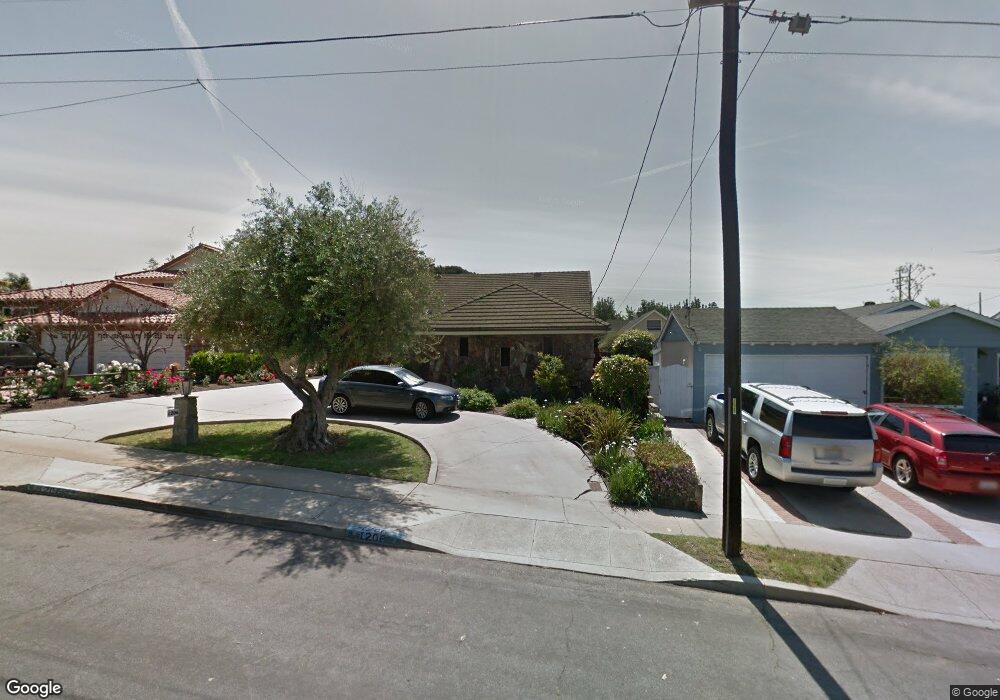
1206 E Sycamore Ave El Segundo, CA 90245
Estimated Value: $2,522,809 - $2,903,000
4
Beds
3
Baths
2,977
Sq Ft
$916/Sq Ft
Est. Value
About This Home
This home is located at 1206 E Sycamore Ave, El Segundo, CA 90245 and is currently estimated at $2,727,452, approximately $916 per square foot. 1206 E Sycamore Ave is a home located in Los Angeles County with nearby schools including Center Street Elementary, El Segundo Middle School, and El Segundo High School.
Ownership History
Date
Name
Owned For
Owner Type
Purchase Details
Closed on
Sep 24, 2002
Sold by
Panfil Mark and Panfil Kendra
Bought by
Reaser Richard L
Current Estimated Value
Home Financials for this Owner
Home Financials are based on the most recent Mortgage that was taken out on this home.
Original Mortgage
$401,000
Outstanding Balance
$164,452
Interest Rate
5.99%
Estimated Equity
$2,563,000
Purchase Details
Closed on
May 23, 1997
Sold by
Sabol John J and Sabol Carolyn J
Bought by
Panfil Mark
Home Financials for this Owner
Home Financials are based on the most recent Mortgage that was taken out on this home.
Original Mortgage
$356,000
Interest Rate
7.94%
Purchase Details
Closed on
Jun 19, 1996
Sold by
Roberts Fredrick C
Bought by
Sabol John J and Sabol Carolyn J
Home Financials for this Owner
Home Financials are based on the most recent Mortgage that was taken out on this home.
Original Mortgage
$325,000
Interest Rate
7.37%
Create a Home Valuation Report for This Property
The Home Valuation Report is an in-depth analysis detailing your home's value as well as a comparison with similar homes in the area
Home Values in the Area
Average Home Value in this Area
Purchase History
| Date | Buyer | Sale Price | Title Company |
|---|---|---|---|
| Reaser Richard L | $885,000 | First American Title Co | |
| Panfil Mark | $445,000 | Continental Title | |
| Sabol John J | $415,000 | Gateway Title Company |
Source: Public Records
Mortgage History
| Date | Status | Borrower | Loan Amount |
|---|---|---|---|
| Open | Reaser Richard L | $401,000 | |
| Previous Owner | Panfil Mark | $356,000 | |
| Previous Owner | Sabol John J | $325,000 | |
| Closed | Panfil Mark | $44,500 | |
| Closed | Reaser Richard L | $128,000 |
Source: Public Records
Tax History
| Year | Tax Paid | Tax Assessment Tax Assessment Total Assessment is a certain percentage of the fair market value that is determined by local assessors to be the total taxable value of land and additions on the property. | Land | Improvement |
|---|---|---|---|---|
| 2025 | $14,315 | $1,281,758 | $752,258 | $529,500 |
| 2024 | $14,315 | $1,256,626 | $737,508 | $519,118 |
| 2023 | $13,941 | $1,231,988 | $723,048 | $508,940 |
| 2022 | $14,090 | $1,207,832 | $708,871 | $498,961 |
| 2021 | $13,884 | $1,184,150 | $694,972 | $489,178 |
| 2019 | $13,413 | $1,149,029 | $674,359 | $474,670 |
| 2018 | $12,471 | $1,126,500 | $661,137 | $465,363 |
| 2016 | $12,099 | $1,082,759 | $635,465 | $447,294 |
| 2015 | $11,947 | $1,066,496 | $625,920 | $440,576 |
| 2014 | $11,687 | $1,045,606 | $613,660 | $431,946 |
Source: Public Records
Map
Nearby Homes
- 825 Center St
- 860 Bungalow Dr
- 1116 E Imperial Ave
- 1112 E Imperial Ave
- 500 E Imperial Ave
- 906 E Imperial Ave
- 1510 E Maple Ave
- 1514 E Maple Ave
- 529 E Walnut Ave
- 519 E Sycamore Ave
- 572 E Imperial Ave
- 426 E Imperial Ave
- 529 Sierra Place
- 329 E Maple Ave
- 432 Lomita St
- 212 E Imperial Ave Unit A
- 212 E Imperial Ave Unit E
- 1225 E Grand Ave Unit B
- 121 E Walnut Ave
- 924 Main St
- 1208 E Sycamore Ave
- 1202 E Sycamore Ave
- 1210 E Sycamore Ave
- 1200 E Sycamore Ave
- 1207 E Maple Ave
- 1209 E Maple Ave
- 1205 E Maple Ave
- 1214 E Sycamore Ave
- 1209 E Sycamore Ave
- 1213 E Maple Ave
- 1201 E Maple Ave
- 1211 E Sycamore Ave
- 822 Center St
- 828 Center St
- 818 Center St
- 1207 E Sycamore Ave
- 1218 E Sycamore Ave
- 812 Center St
- 1219 E Maple Ave
- 1205 E Sycamore Ave
Your Personal Tour Guide
Ask me questions while you tour the home.