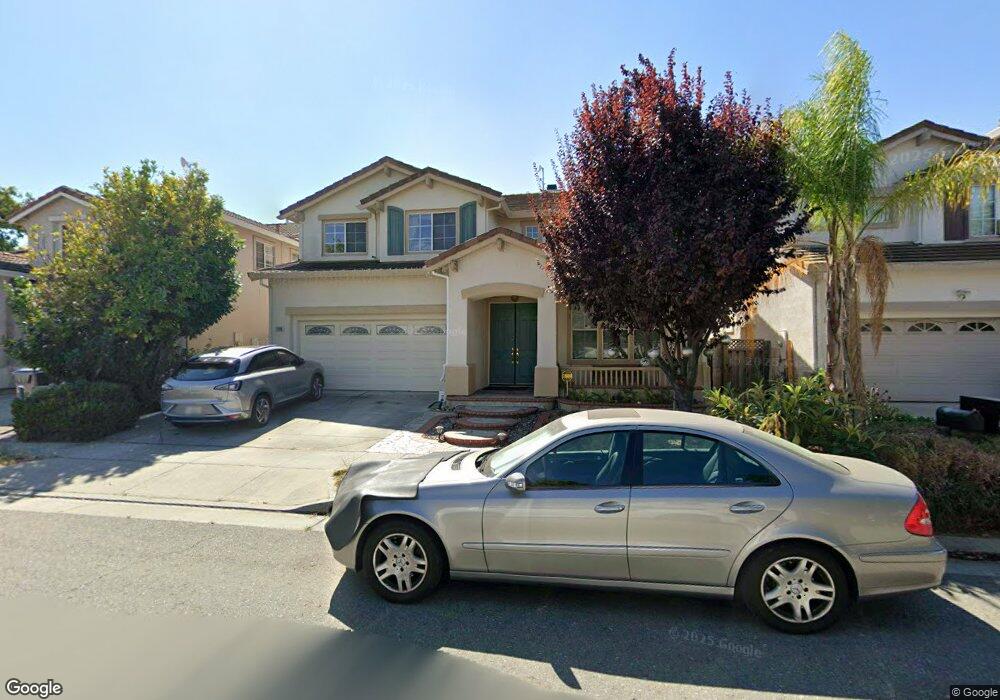
1206 Mayberry Ln San Jose, CA 95131
North Valley NeighborhoodEstimated Value: $1,936,736 - $2,337,000
5
Beds
3
Baths
2,410
Sq Ft
$900/Sq Ft
Est. Value
About This Home
This home is located at 1206 Mayberry Ln, San Jose, CA 95131 and is currently estimated at $2,169,684, approximately $900 per square foot. 1206 Mayberry Ln is a home located in Santa Clara County with nearby schools including Brooktree Elementary School, Morrill Middle School, and Independence High School.
Ownership History
Date
Name
Owned For
Owner Type
Purchase Details
Closed on
Dec 3, 2020
Sold by
Lee Kenneth K and Lee Jamie W
Bought by
Lee Kenneth K and Lee Jamie Wei
Current Estimated Value
Home Financials for this Owner
Home Financials are based on the most recent Mortgage that was taken out on this home.
Original Mortgage
$350,000
Outstanding Balance
$254,597
Interest Rate
2.8%
Mortgage Type
New Conventional
Estimated Equity
$1,915,087
Purchase Details
Closed on
Dec 2, 2020
Sold by
Lee Kenneth K and Lee Jamie Wei
Bought by
Lee Family Trust and Lee
Home Financials for this Owner
Home Financials are based on the most recent Mortgage that was taken out on this home.
Original Mortgage
$350,000
Outstanding Balance
$254,597
Interest Rate
2.8%
Mortgage Type
New Conventional
Estimated Equity
$1,915,087
Purchase Details
Closed on
Apr 25, 2006
Sold by
Lee Kenneth K and Lee Jamie W
Bought by
Lee Kenneth K and Lee Jamie W
Purchase Details
Closed on
Dec 15, 1998
Sold by
Braddock & Logan Group Lp
Bought by
Lee Kenneth K and Lee Jamie Wei
Home Financials for this Owner
Home Financials are based on the most recent Mortgage that was taken out on this home.
Original Mortgage
$320,000
Interest Rate
6.86%
Create a Home Valuation Report for This Property
The Home Valuation Report is an in-depth analysis detailing your home's value as well as a comparison with similar homes in the area
Home Values in the Area
Average Home Value in this Area
Purchase History
| Date | Buyer | Sale Price | Title Company |
|---|---|---|---|
| Lee Kenneth K | -- | Chicago Title Company | |
| Lee Family Trust | -- | Chicago Title | |
| Lee Kenneth K | -- | Chicago Title | |
| Lee Kenneth K | -- | None Available | |
| Lee Kenneth K | $469,500 | First American Title Guarant |
Source: Public Records
Mortgage History
| Date | Status | Borrower | Loan Amount |
|---|---|---|---|
| Open | Lee Kenneth K | $350,000 | |
| Closed | Lee Kenneth K | $350,000 | |
| Previous Owner | Lee Kenneth K | $320,000 |
Source: Public Records
Tax History
| Year | Tax Paid | Tax Assessment Tax Assessment Total Assessment is a certain percentage of the fair market value that is determined by local assessors to be the total taxable value of land and additions on the property. | Land | Improvement |
|---|---|---|---|---|
| 2025 | $10,396 | $736,006 | $313,534 | $422,472 |
| 2024 | $10,396 | $721,576 | $307,387 | $414,189 |
| 2023 | $10,206 | $707,428 | $301,360 | $406,068 |
| 2022 | $10,167 | $693,557 | $295,451 | $398,106 |
| 2021 | $9,925 | $679,958 | $289,658 | $390,300 |
| 2020 | $9,529 | $672,986 | $286,688 | $386,298 |
| 2019 | $9,160 | $659,791 | $281,067 | $378,724 |
| 2018 | $9,173 | $646,855 | $275,556 | $371,299 |
| 2017 | $9,226 | $634,172 | $270,153 | $364,019 |
| 2016 | $8,843 | $621,738 | $264,856 | $356,882 |
| 2015 | $8,739 | $612,400 | $260,878 | $351,522 |
| 2014 | $8,029 | $600,405 | $255,768 | $344,637 |
Source: Public Records
Map
Nearby Homes
- 1391 Lee Place
- 1287 Hazlett Ct
- 1021 Onofrio Ln Unit 3
- 1013 Onofrio Ln Unit 2
- 1573 de Rome Dr Unit 1
- 1038 Giacomo Ln
- 1011 Giacomo Ln Unit 1
- 1567 Thornbriar Dr
- 1712 Heavenly Bamboo Ct
- 1291 Royal Crest Dr
- 1153 Rosebriar Way
- 1146 Rosebriar Way
- 1131 Chen St
- 1358 Oakland Rd
- 1358 Old Oakland Unit 120
- 1325 Araujo St
- 1337 Araujo St
- 900 Golden Wheel Park Dr Unit 121
- 900 Golden Wheel Park Dr Unit 33
- 1729 Maysong Ct
- 1212 Mayberry Ln
- 1200 Mayberry Ln
- 1218 Mayberry Ln
- 1421 Bellemeade St
- 1209 Mayberry Ln
- 1228 Mayberry Ln
- 1215 Mayberry Ln
- 1318 Harefield Ct
- 1400 Bellemeade St
- 1406 Bellemeade St
- 1323 Chessington Dr
- 1427 Bellemeade St
- 1412 Bellemeade St
- 1221 Mayberry Ln
- 1230 Mayberry Ln
- 1418 Bellemeade St
- 1227 Mayberry Ln
- 1314 Harefield Ct
- 1342 Legend Ln
- 1319 Chessington Dr
Your Personal Tour Guide
Ask me questions while you tour the home.