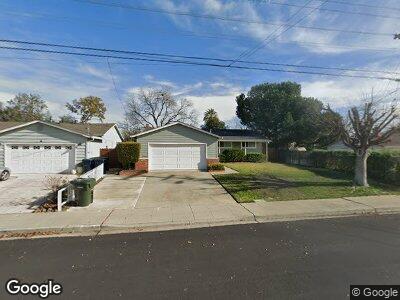
1206 Wagoner Dr Livermore, CA 94550
Sunset West NeighborhoodEstimated Value: $1,176,000 - $1,230,000
4
Beds
2
Baths
1,392
Sq Ft
$859/Sq Ft
Est. Value
About This Home
This home is located at 1206 Wagoner Dr, Livermore, CA 94550 and is currently estimated at $1,195,309, approximately $858 per square foot. 1206 Wagoner Dr is a home located in Alameda County with nearby schools including Joe Michell K-8 School, Granada High School, and St Michael's School.
Ownership History
Date
Name
Owned For
Owner Type
Purchase Details
Closed on
Dec 3, 2009
Sold by
Strope Randy and Strope Cyndee
Bought by
Bailey Teresa Susanne
Current Estimated Value
Purchase Details
Closed on
Sep 23, 2009
Sold by
Strope Randy and Strope Cyndee
Bought by
Strope Randy and Strope Cyndee
Home Financials for this Owner
Home Financials are based on the most recent Mortgage that was taken out on this home.
Original Mortgage
$100,000
Interest Rate
5.25%
Mortgage Type
Stand Alone Refi Refinance Of Original Loan
Purchase Details
Closed on
Jul 29, 2009
Sold by
Sullivan Barbara J and Schoenfelder Karl D
Bought by
Strope Randy and Strope Cyndee
Home Financials for this Owner
Home Financials are based on the most recent Mortgage that was taken out on this home.
Original Mortgage
$100,000
Interest Rate
5.25%
Mortgage Type
Stand Alone Refi Refinance Of Original Loan
Purchase Details
Closed on
Dec 25, 2001
Sold by
Schoenfelder Armida M and Schoenfelder Armida
Bought by
Schoenfelder Armida M and The Armida M Schoenfelder Revo
Create a Home Valuation Report for This Property
The Home Valuation Report is an in-depth analysis detailing your home's value as well as a comparison with similar homes in the area
Home Values in the Area
Average Home Value in this Area
Purchase History
| Date | Buyer | Sale Price | Title Company |
|---|---|---|---|
| Bailey Teresa Susanne | $450,000 | Chicago Title Company | |
| Strope Randy | -- | Chicago Title Company | |
| Strope Randy | $312,500 | Chicago Title Company | |
| Schoenfelder Armida M | -- | -- | |
| Schoenfelder Armida M | -- | -- |
Source: Public Records
Mortgage History
| Date | Status | Borrower | Loan Amount |
|---|---|---|---|
| Open | Bailey Teresa Susanne | $390,000 | |
| Closed | Bailey Teresa Susanne | $415,000 | |
| Closed | Bailey Teresa Susanne | $426,870 | |
| Previous Owner | Strope Randy | $100,000 |
Source: Public Records
Tax History Compared to Growth
Tax History
| Year | Tax Paid | Tax Assessment Tax Assessment Total Assessment is a certain percentage of the fair market value that is determined by local assessors to be the total taxable value of land and additions on the property. | Land | Improvement |
|---|---|---|---|---|
| 2024 | $7,531 | $562,443 | $170,833 | $398,610 |
| 2023 | $7,413 | $558,278 | $167,483 | $390,795 |
| 2022 | $7,302 | $540,334 | $164,200 | $383,134 |
| 2021 | $6,407 | $529,606 | $160,982 | $375,624 |
| 2020 | $6,938 | $531,107 | $159,332 | $371,775 |
| 2019 | $6,963 | $520,694 | $156,208 | $364,486 |
| 2018 | $6,811 | $510,488 | $153,146 | $357,342 |
| 2017 | $6,633 | $500,480 | $150,144 | $350,336 |
| 2016 | $6,384 | $490,670 | $147,201 | $343,469 |
| 2015 | $5,992 | $483,304 | $144,991 | $338,313 |
| 2014 | $5,886 | $473,840 | $142,152 | $331,688 |
Source: Public Records
Map
Nearby Homes
- 1079 El Dorado Dr
- 773 Grace Ct
- 1124 Via Granada
- 831 Wagoner Dr
- 643 Via Del Sol
- 1001 Murrieta Blvd Unit 88
- 975 Murrieta Blvd Unit 47
- 975 Murrieta Blvd Unit 46
- 975 Murrieta Blvd Unit 38
- 1009 Murrieta Blvd Unit 5
- 937 Florence Rd
- 1087 Murrieta Blvd Unit 244
- 1087 Murrieta Blvd Unit 151
- 1087 Murrieta Blvd Unit 349
- 1085 Murrieta Blvd Unit 318
- 1085 Murrieta Blvd Unit 305
- 1196 Holmes Ct
- 1205 Marguerite St
- 889 Laguna St
- 538 Anna Maria St
- 1206 Wagoner Dr
- 1190 Wagoner Dr
- 1222 Wagoner Dr
- 916 El Caminito
- 1174 Wagoner Dr
- 930 El Caminito
- 1195 Wagoner Dr
- 1217 Wagoner Dr
- 1179 Wagoner Dr
- 1233 Wagoner Dr
- 1158 Wagoner Dr
- 944 El Caminito
- 1163 Wagoner Dr
- 1248 Wagoner Dr
- 958 El Caminito
- 1142 Wagoner Dr
- 1212 Camelia Dr
- 1224 Camelia Dr
- 1145 Wagoner Dr
- 917 El Caminito