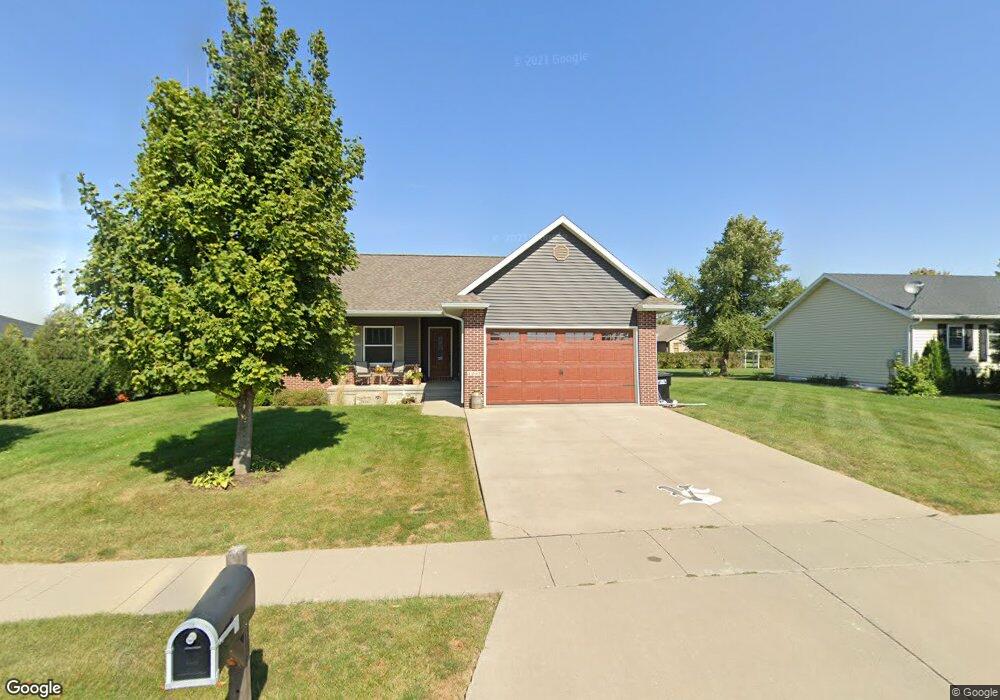
1207 E 16th St Vinton, IA 52349
Estimated Value: $231,000 - $340,000
4
Beds
4
Baths
1,293
Sq Ft
$215/Sq Ft
Est. Value
About This Home
This home is located at 1207 E 16th St, Vinton, IA 52349 and is currently estimated at $277,833, approximately $214 per square foot. 1207 E 16th St is a home located in Benton County with nearby schools including Tilford Elementary School, Vinton-Shellsburg Middle School, and Vinton-Shellsburg High School.
Ownership History
Date
Name
Owned For
Owner Type
Purchase Details
Closed on
Oct 9, 2024
Sold by
Sutton Benjamin David
Bought by
Benjamin David Sutton Testamentary Trust and Sutton
Current Estimated Value
Purchase Details
Closed on
Feb 13, 2008
Sold by
Future Builders L L C
Bought by
Sutton Benjamin D and Sutton Marla L
Home Financials for this Owner
Home Financials are based on the most recent Mortgage that was taken out on this home.
Original Mortgage
$29,000
Interest Rate
6.11%
Mortgage Type
Credit Line Revolving
Create a Home Valuation Report for This Property
The Home Valuation Report is an in-depth analysis detailing your home's value as well as a comparison with similar homes in the area
Home Values in the Area
Average Home Value in this Area
Purchase History
| Date | Buyer | Sale Price | Title Company |
|---|---|---|---|
| Benjamin David Sutton Testamentary Trust | -- | None Listed On Document | |
| Sutton Benjamin D | $145,000 | None Available |
Source: Public Records
Mortgage History
| Date | Status | Borrower | Loan Amount |
|---|---|---|---|
| Previous Owner | Sutton Benjamin D | $29,000 |
Source: Public Records
Tax History
| Year | Tax Paid | Tax Assessment Tax Assessment Total Assessment is a certain percentage of the fair market value that is determined by local assessors to be the total taxable value of land and additions on the property. | Land | Improvement |
|---|---|---|---|---|
| 2025 | $3,946 | $237,800 | $42,000 | $195,800 |
| 2024 | $3,946 | $220,800 | $40,900 | $179,900 |
| 2023 | $3,738 | $220,800 | $40,900 | $179,900 |
| 2022 | $3,738 | $182,600 | $32,700 | $149,900 |
| 2021 | $3,836 | $182,600 | $32,700 | $149,900 |
| 2020 | $3,172 | $155,400 | $20,700 | $134,700 |
| 2019 | $3,180 | $155,400 | $20,700 | $134,700 |
| 2018 | $3,086 | $153,600 | $19,800 | $133,800 |
| 2017 | $2,960 | $153,600 | $19,800 | $133,800 |
| 2016 | $2,908 | $143,500 | $18,500 | $125,000 |
| 2015 | $2,908 | $143,500 | $18,500 | $125,000 |
| 2014 | $2,926 | $144,000 | $0 | $0 |
Source: Public Records
Map
Nearby Homes
Your Personal Tour Guide
Ask me questions while you tour the home.