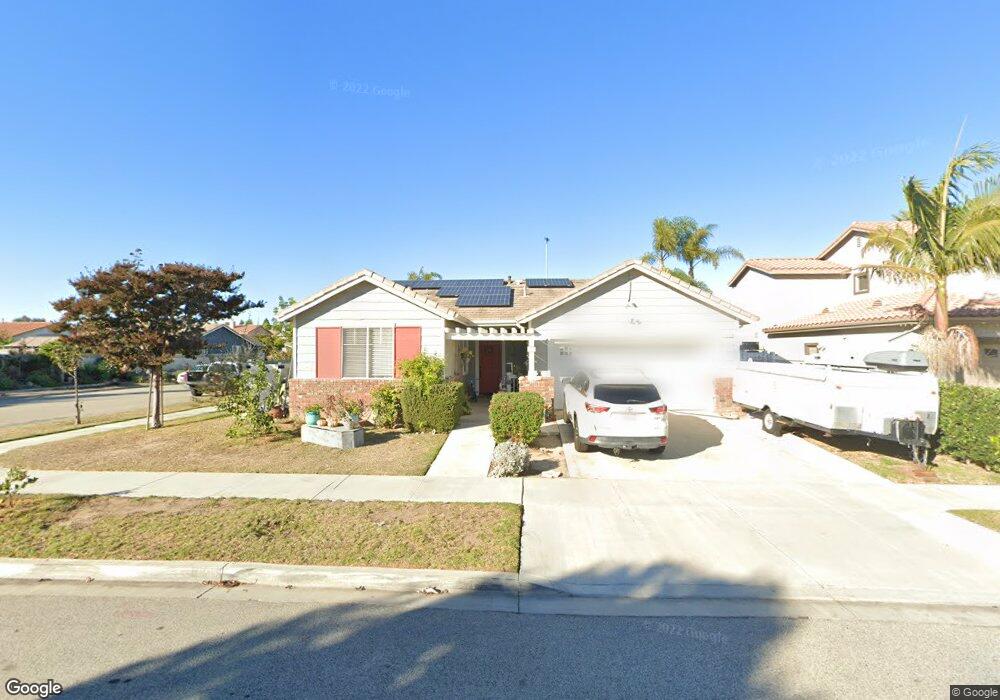
1207 Mika Way Oxnard, CA 93030
West Village NeighborhoodEstimated Value: $756,000 - $858,000
3
Beds
2
Baths
1,606
Sq Ft
$509/Sq Ft
Est. Value
About This Home
This home is located at 1207 Mika Way, Oxnard, CA 93030 and is currently estimated at $817,987, approximately $509 per square foot. 1207 Mika Way is a home located in Ventura County with nearby schools including Brekke Elementary School, R.J. Frank Academy of Marine Science & Engineering, and Pacifica High School.
Ownership History
Date
Name
Owned For
Owner Type
Purchase Details
Closed on
Mar 5, 2013
Sold by
Svestka Misty Maria
Bought by
Svestka Misty Maria and The Svestka Trust
Current Estimated Value
Home Financials for this Owner
Home Financials are based on the most recent Mortgage that was taken out on this home.
Original Mortgage
$236,000
Outstanding Balance
$166,161
Interest Rate
3.49%
Mortgage Type
New Conventional
Estimated Equity
$651,826
Purchase Details
Closed on
Sep 1, 2009
Sold by
Svestka Misty M
Bought by
Svestka Misty Maria
Purchase Details
Closed on
Jan 25, 2001
Sold by
Standard Pacific Corp
Bought by
Svestka Misty M
Home Financials for this Owner
Home Financials are based on the most recent Mortgage that was taken out on this home.
Original Mortgage
$208,000
Interest Rate
7.12%
Create a Home Valuation Report for This Property
The Home Valuation Report is an in-depth analysis detailing your home's value as well as a comparison with similar homes in the area
Home Values in the Area
Average Home Value in this Area
Purchase History
| Date | Buyer | Sale Price | Title Company |
|---|---|---|---|
| Svestka Misty Maria | -- | Lawyes Title | |
| Svestka Misty Maria | -- | Lawyers Title | |
| Svestka Misty Maria | -- | None Available | |
| Svestka Misty M | $260,500 | First American Title Ins Co |
Source: Public Records
Mortgage History
| Date | Status | Borrower | Loan Amount |
|---|---|---|---|
| Open | Svestka Misty Maria | $236,000 | |
| Closed | Svestka Misty M | $208,000 |
Source: Public Records
Tax History
| Year | Tax Paid | Tax Assessment Tax Assessment Total Assessment is a certain percentage of the fair market value that is determined by local assessors to be the total taxable value of land and additions on the property. | Land | Improvement |
|---|---|---|---|---|
| 2025 | $5,271 | $394,323 | $156,816 | $237,507 |
| 2024 | $5,271 | $386,592 | $153,742 | $232,850 |
| 2023 | $4,795 | $379,012 | $150,727 | $228,285 |
| 2022 | $4,477 | $371,581 | $147,772 | $223,809 |
| 2021 | $4,669 | $364,296 | $144,875 | $219,421 |
| 2020 | $4,751 | $360,563 | $143,391 | $217,172 |
| 2019 | $4,569 | $353,494 | $140,580 | $212,914 |
| 2018 | $4,364 | $346,564 | $137,824 | $208,740 |
| 2017 | $4,058 | $339,770 | $135,122 | $204,648 |
| 2016 | $4,116 | $333,109 | $132,473 | $200,636 |
| 2015 | $4,341 | $328,107 | $130,484 | $197,623 |
| 2014 | $4,296 | $321,681 | $127,929 | $193,752 |
Source: Public Records
Map
Nearby Homes
- 565 Rosalinda Dr
- 400 N Hayes Ave
- 1902 Ribera Dr Unit 86
- 1930 Ribera Dr
- 255 Douglas Ave
- 246 Doris Ave
- 403 E 2nd St
- 208 Bolero Ln
- 450 W Roderick Ave
- 2010 Camino Del Sol
- 211 Featherstone St
- 2030 Ocaso Place
- 800 S A St
- 2012 Blackberry Cir
- 207 Hermano Trail
- 425 W 1st St
- 2016 Blackberry Cir
- 2041 Blackberry Cir
- 2031 Blackberry Cir
- 722 W Robert Ave
Your Personal Tour Guide
Ask me questions while you tour the home.