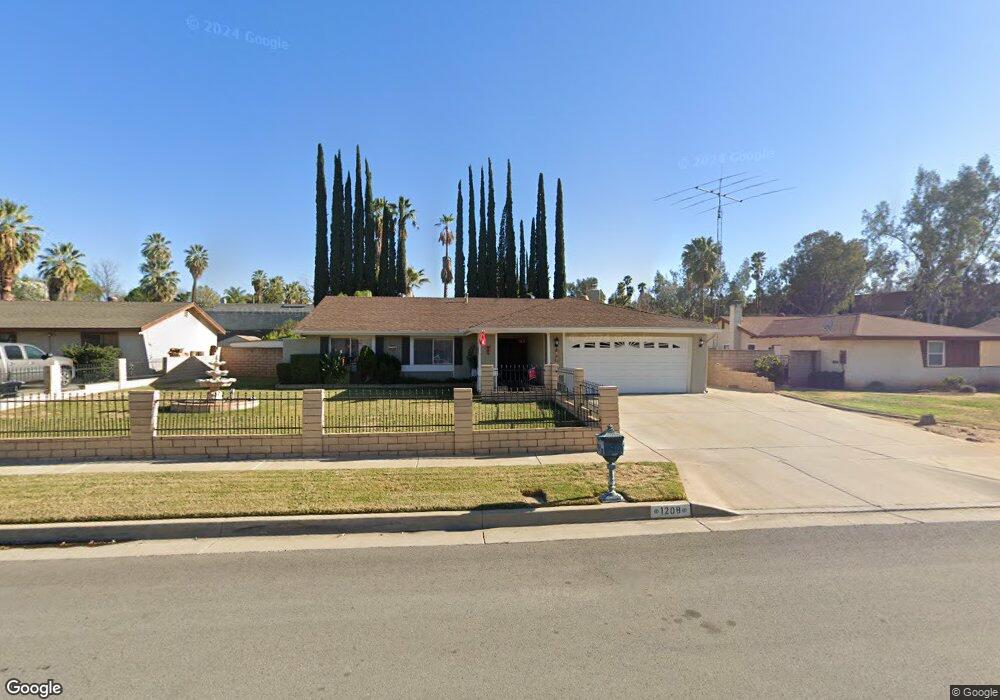
1208 Begonia Ct Redlands, CA 92374
South Redlands NeighborhoodEstimated Value: $599,163 - $651,000
4
Beds
2
Baths
1,499
Sq Ft
$420/Sq Ft
Est. Value
About This Home
This home is located at 1208 Begonia Ct, Redlands, CA 92374 and is currently estimated at $629,041, approximately $419 per square foot. 1208 Begonia Ct is a home located in San Bernardino County with nearby schools including Mariposa Elementary School, Moore Middle School, and Redlands East Valley High School.
Ownership History
Date
Name
Owned For
Owner Type
Purchase Details
Closed on
Aug 13, 1999
Sold by
Bainter Stephen L
Bought by
Bainter Stephen L and Bainter Linda D
Current Estimated Value
Home Financials for this Owner
Home Financials are based on the most recent Mortgage that was taken out on this home.
Original Mortgage
$173,735
Outstanding Balance
$49,847
Interest Rate
7.63%
Estimated Equity
$579,194
Purchase Details
Closed on
Nov 21, 1996
Sold by
Draper Michael L and Draper Kaye F
Bought by
Painter Stephen L and Griffenhagen Linda D
Home Financials for this Owner
Home Financials are based on the most recent Mortgage that was taken out on this home.
Original Mortgage
$135,608
Interest Rate
7.91%
Mortgage Type
FHA
Create a Home Valuation Report for This Property
The Home Valuation Report is an in-depth analysis detailing your home's value as well as a comparison with similar homes in the area
Home Values in the Area
Average Home Value in this Area
Purchase History
| Date | Buyer | Sale Price | Title Company |
|---|---|---|---|
| Bainter Stephen L | -- | Fidelity National Title | |
| Painter Stephen L | $137,500 | Fidelity National Title |
Source: Public Records
Mortgage History
| Date | Status | Borrower | Loan Amount |
|---|---|---|---|
| Open | Bainter Stephen L | $173,735 | |
| Closed | Painter Stephen L | $135,608 | |
| Closed | Bainter Stephen L | $25,000 |
Source: Public Records
Tax History Compared to Growth
Tax History
| Year | Tax Paid | Tax Assessment Tax Assessment Total Assessment is a certain percentage of the fair market value that is determined by local assessors to be the total taxable value of land and additions on the property. | Land | Improvement |
|---|---|---|---|---|
| 2025 | $2,625 | $223,940 | $57,004 | $166,936 |
| 2024 | $2,625 | $219,549 | $55,886 | $163,663 |
| 2023 | $2,622 | $215,244 | $54,790 | $160,454 |
| 2022 | $2,584 | $211,024 | $53,716 | $157,308 |
| 2021 | $2,631 | $206,887 | $52,663 | $154,224 |
| 2020 | $2,592 | $204,766 | $52,123 | $152,643 |
| 2019 | $2,520 | $200,751 | $51,101 | $149,650 |
| 2018 | $2,458 | $196,815 | $50,099 | $146,716 |
| 2017 | $2,437 | $192,956 | $49,117 | $143,839 |
| 2016 | $2,410 | $189,173 | $48,154 | $141,019 |
| 2015 | $2,392 | $186,332 | $47,431 | $138,901 |
| 2014 | $2,350 | $182,682 | $46,502 | $136,180 |
Source: Public Records
Map
Nearby Homes
- 743 Mcauliffe Ct
- 733 S Grove St
- 1033 Evergreen Ct
- 1200 E Highland Ave Unit 207
- 1432 Moore St
- 1442 Moore St
- 977 Ardmore Cir
- Belmont Plan at Havenwood
- Camden Plan at Havenwood
- Lexington Plan at Havenwood
- Windsor Plan at Havenwood
- 1446 Moore St
- 837 Ardmore Cir
- 724 E Palm Ave
- 1502 Marion Rd
- 149 Lido St
- 327 Naomi St
- 1563 Gary Ln
- 1427 Laramie Ave
- 455 Judson St
- 1204 Begonia Ct
- 1212 Begonia Ct
- 1209 Cambon Ct
- 1213 Cambon Ct
- 1205 Cambon Ct
- 1200 Begonia Ct
- 1209 Begonia Ct
- 1205 Begonia Ct
- 1213 Begonia Ct
- 1201 Cambon Ct
- 905 S Grove St
- 905 S Grove St
- 1201 Begonia Ct
- 855 S Grove St
- 945 S Grove St
- 1210 E Palm Ave
- 1210 Cambon Ct
- 1206 E Palm Ave
- 814 S Grove St
- 1214 Cambon Ct