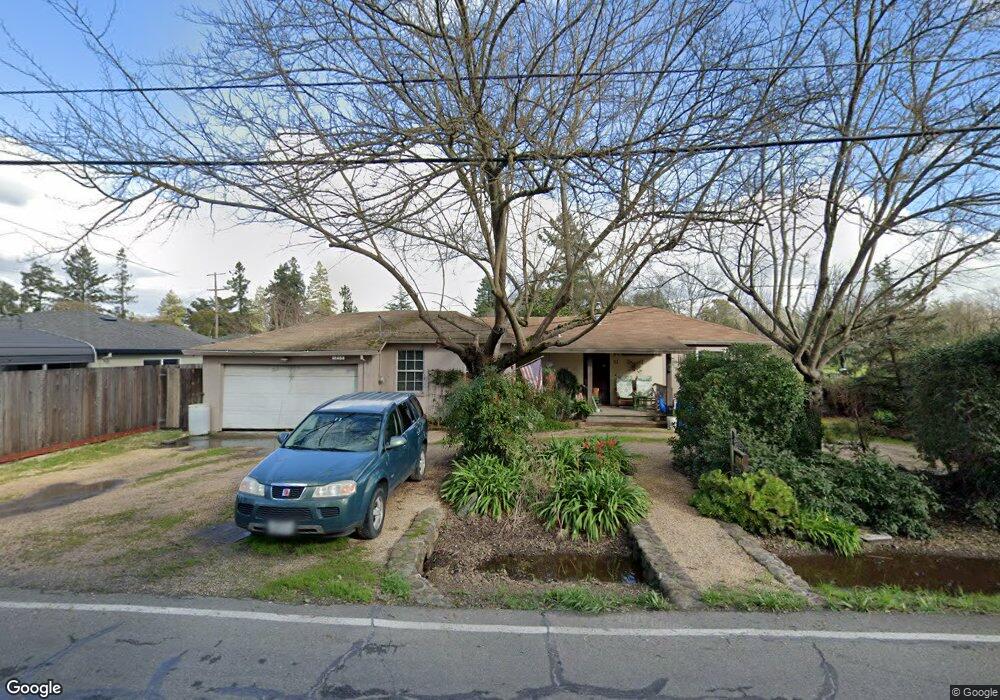
1208 Burbank Ave Santa Rosa, CA 95407
Estimated Value: $500,000 - $576,000
2
Beds
1
Bath
1,041
Sq Ft
$508/Sq Ft
Est. Value
About This Home
This home is located at 1208 Burbank Ave, Santa Rosa, CA 95407 and is currently estimated at $528,723, approximately $507 per square foot. 1208 Burbank Ave is a home located in Sonoma County with nearby schools including Elsie Allen High School and St. Michael's Orthodox School.
Ownership History
Date
Name
Owned For
Owner Type
Purchase Details
Closed on
Sep 8, 1999
Sold by
Wilson Denton C and Gilberth Jeanne M
Bought by
Wilson Denton C
Current Estimated Value
Home Financials for this Owner
Home Financials are based on the most recent Mortgage that was taken out on this home.
Original Mortgage
$127,200
Outstanding Balance
$38,493
Interest Rate
8.09%
Estimated Equity
$490,231
Purchase Details
Closed on
Oct 7, 1998
Sold by
Bankers Trust Company Of California Na
Bought by
Wilson Denton C and Gilbreth Jeanne M
Home Financials for this Owner
Home Financials are based on the most recent Mortgage that was taken out on this home.
Original Mortgage
$100,000
Interest Rate
6.6%
Purchase Details
Closed on
Jul 7, 1998
Sold by
Lansing John Charles
Bought by
The Silver Remic Trust I and Bank Of America Nt & Sa
Create a Home Valuation Report for This Property
The Home Valuation Report is an in-depth analysis detailing your home's value as well as a comparison with similar homes in the area
Home Values in the Area
Average Home Value in this Area
Purchase History
| Date | Buyer | Sale Price | Title Company |
|---|---|---|---|
| Wilson Denton C | $64,000 | Financial Title Company | |
| Wilson Denton C | $140,000 | Fidelity National Title Co | |
| The Silver Remic Trust I | $131,212 | Fidelity National Title |
Source: Public Records
Mortgage History
| Date | Status | Borrower | Loan Amount |
|---|---|---|---|
| Open | Wilson Denton C | $127,200 | |
| Previous Owner | Wilson Denton C | $100,000 |
Source: Public Records
Tax History Compared to Growth
Tax History
| Year | Tax Paid | Tax Assessment Tax Assessment Total Assessment is a certain percentage of the fair market value that is determined by local assessors to be the total taxable value of land and additions on the property. | Land | Improvement |
|---|---|---|---|---|
| 2025 | $3,184 | $224,378 | $111,419 | $112,959 |
| 2024 | $3,184 | $219,980 | $109,235 | $110,745 |
| 2023 | $3,184 | $215,668 | $107,094 | $108,574 |
| 2022 | $3,057 | $211,441 | $104,995 | $106,446 |
| 2021 | $3,014 | $207,296 | $102,937 | $104,359 |
| 2020 | $2,987 | $205,171 | $101,882 | $103,289 |
| 2019 | $2,972 | $201,149 | $99,885 | $101,264 |
| 2018 | $3,058 | $197,206 | $97,927 | $99,279 |
| 2017 | $3,061 | $193,340 | $96,007 | $97,333 |
| 2016 | $3,005 | $189,550 | $94,125 | $95,425 |
| 2015 | $2,908 | $186,704 | $92,712 | $93,992 |
| 2014 | $2,799 | $183,047 | $90,896 | $92,151 |
Source: Public Records
Map
Nearby Homes
- 1521 Hughes Ave
- 59 Roundelay Ln
- 62 Romani Ct
- 70 Romani Ct
- 0 West Ave Unit 325019616
- 2006 Lazzini Ave
- 2002 Marble St
- 1953 Alamo Ln
- 1538 Surrey Dr
- 733 Leo Dr
- 534 E Jasmine Cir
- 1630 Mathwig Dr
- 1461 Trombetta St
- 576 E Jasmine Cir
- 628 Wisteria Ln
- 780 Dutton Ave
- 2542 Buss Dr
- 2488 Giffen Ave
- 751 W Jasmine Cir Unit 3
- 1447 Beachwood Dr
- 1200 Burbank Ave
- 1258 Hughes Ave
- 1215 Burbank Ave
- 1252 Hughes Ave
- 1410 Hughes Ave
- 1269 Hughes Ave
- 1428 Hughes Ave
- 1236 Hughes Ave
- 1263 Hughes Ave
- 1267 Burbank Ave
- 1219 Burbank Ave
- 1255 Hughes Ave
- 1119 Burbank Ave
- 1454 Hughes Ave
- 1237 Hughes Ave
- 1224 Hughes Ave
- 1425 Hughes Ave
- 1102 Burbank Ave
- 1229 Hughes Ave
- 1285 Burbank Ave