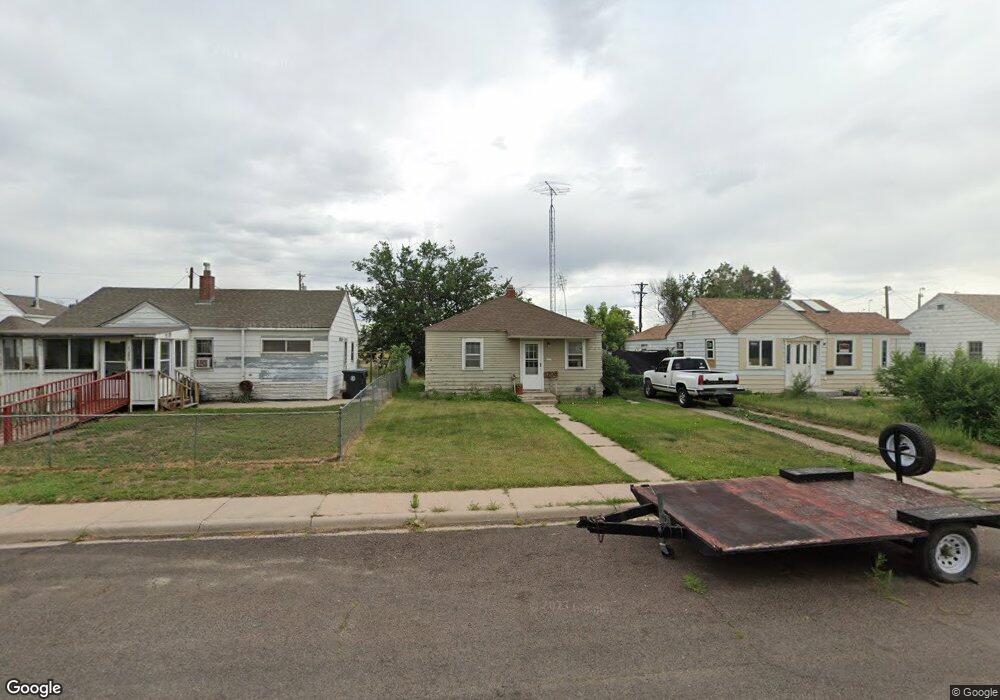
1208 E 7th St Cheyenne, WY 82007
South Cheyenne NeighborhoodEstimated Value: $143,000 - $206,000
Studio
--
Bath
552
Sq Ft
$335/Sq Ft
Est. Value
About This Home
This home is located at 1208 E 7th St, Cheyenne, WY 82007 and is currently estimated at $184,695, approximately $334 per square foot. 1208 E 7th St is a home located in Laramie County with nearby schools including Hebard Elementary School, Johnson Junior High School, and South High School.
Ownership History
Date
Name
Owned For
Owner Type
Purchase Details
Closed on
Feb 2, 2024
Sold by
Helzer David M and Mcleod Donald M
Bought by
Helzer David M
Current Estimated Value
Purchase Details
Closed on
Dec 10, 2007
Sold by
Fannie Mae
Bought by
Helzer David M and Mcleod Donald M
Purchase Details
Closed on
Aug 28, 2007
Sold by
Blanton Robert and Blanton Krystalyn
Bought by
Federal National Mortgage Association
Purchase Details
Closed on
Apr 23, 2007
Sold by
Blanton Robert and Blanton Krystalyn
Bought by
Mortgage Electronic Registration Systems
Purchase Details
Closed on
May 31, 2006
Sold by
Barb Alison Real Estate Co Llc
Bought by
Blanton Robert and Blanton Krystalyn
Home Financials for this Owner
Home Financials are based on the most recent Mortgage that was taken out on this home.
Original Mortgage
$60,770
Interest Rate
6.5%
Mortgage Type
Purchase Money Mortgage
Purchase Details
Closed on
Jun 30, 1998
Sold by
Northcutt Alice T
Bought by
Barb Alison Real Estate Company Llc
Create a Home Valuation Report for This Property
The Home Valuation Report is an in-depth analysis detailing your home's value as well as a comparison with similar homes in the area
Home Values in the Area
Average Home Value in this Area
Purchase History
| Date | Buyer | Sale Price | Title Company |
|---|---|---|---|
| Helzer David M | -- | None Listed On Document | |
| Helzer David M | -- | None Available | |
| Federal National Mortgage Association | $67,460 | None Available | |
| Mortgage Electronic Registration Systems | $67,460 | None Available | |
| Blanton Robert | -- | Summit Title Services | |
| Barb Alison Real Estate Company Llc | -- | -- |
Source: Public Records
Mortgage History
| Date | Status | Borrower | Loan Amount |
|---|---|---|---|
| Previous Owner | Blanton Robert | $60,770 |
Source: Public Records
Tax History
| Year | Tax Paid | Tax Assessment Tax Assessment Total Assessment is a certain percentage of the fair market value that is determined by local assessors to be the total taxable value of land and additions on the property. | Land | Improvement |
|---|---|---|---|---|
| 2025 | $825 | $8,911 | $2,404 | $6,507 |
| 2024 | $825 | $11,668 | $3,206 | $8,462 |
| 2023 | $802 | $11,343 | $3,206 | $8,137 |
| 2022 | $721 | $9,994 | $3,206 | $6,788 |
| 2021 | $670 | $9,261 | $3,206 | $6,055 |
| 2020 | $621 | $8,611 | $3,206 | $5,405 |
| 2019 | $589 | $8,158 | $3,206 | $4,952 |
| 2018 | $517 | $7,227 | $2,804 | $4,423 |
| 2017 | $449 | $6,221 | $1,854 | $4,367 |
| 2016 | $407 | $5,640 | $1,722 | $3,918 |
| 2015 | $368 | $5,089 | $1,722 | $3,367 |
| 2014 | $369 | $5,081 | $1,739 | $3,342 |
Source: Public Records
Map
Nearby Homes
- 1212 E 7th St
- 807 E 3rd St
- 615 E 6th St
- 2119 E 11th St
- 2107 E 12th St
- 516 E 4th St
- 2532 E 9th St
- 2418 E 11th St
- 903 Hot Springs Ave
- 306 Evans Ave
- 614 Broken Wheel Ct
- 1605 E 16th St
- 2521 E 12th St
- 1410 Carbon Ave Unit A-D
- 2621 E 10th St
- 714 E 15th St
- 2709 E 9th St
- 415 Wasatch St
- 1501 Carbon Ave
- 701 E Lincolnway
Your Personal Tour Guide
Ask me questions while you tour the home.