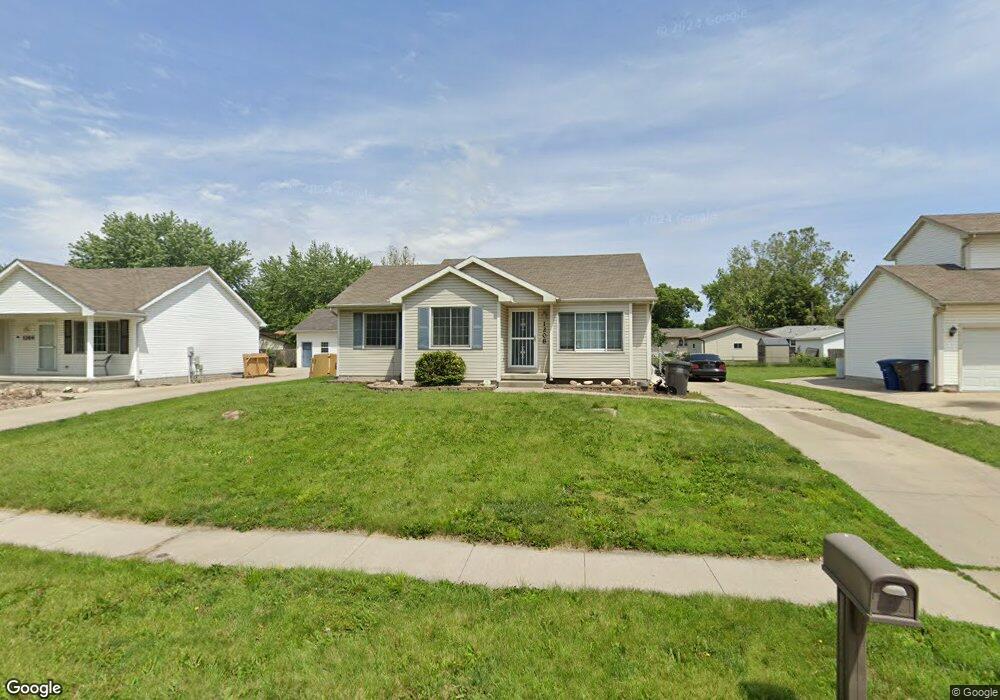
1208 Jerlynn Ave Des Moines, IA 50313
Highland Park NeighborhoodEstimated Value: $218,680 - $288,000
4
Beds
1
Bath
1,125
Sq Ft
$226/Sq Ft
Est. Value
About This Home
This home is located at 1208 Jerlynn Ave, Des Moines, IA 50313 and is currently estimated at $254,170, approximately $225 per square foot. 1208 Jerlynn Ave is a home located in Polk County with nearby schools including Madison Elementary School, Harding Middle School, and North High School.
Ownership History
Date
Name
Owned For
Owner Type
Purchase Details
Closed on
Aug 15, 2014
Sold by
Vestal Lori and Vestal Phillip
Bought by
Lundstrom Monica
Current Estimated Value
Home Financials for this Owner
Home Financials are based on the most recent Mortgage that was taken out on this home.
Original Mortgage
$125,400
Outstanding Balance
$95,617
Interest Rate
4.11%
Mortgage Type
New Conventional
Estimated Equity
$158,553
Purchase Details
Closed on
Nov 3, 2006
Sold by
Anderson Timothy and Anderson Lori
Bought by
Anderson Lori
Home Financials for this Owner
Home Financials are based on the most recent Mortgage that was taken out on this home.
Original Mortgage
$122,000
Interest Rate
6.33%
Mortgage Type
New Conventional
Purchase Details
Closed on
Oct 9, 2002
Sold by
Cardinal Development Llc
Bought by
Anderson Timothy and Anderson Lori
Home Financials for this Owner
Home Financials are based on the most recent Mortgage that was taken out on this home.
Original Mortgage
$125,372
Interest Rate
6.24%
Create a Home Valuation Report for This Property
The Home Valuation Report is an in-depth analysis detailing your home's value as well as a comparison with similar homes in the area
Home Values in the Area
Average Home Value in this Area
Purchase History
| Date | Buyer | Sale Price | Title Company |
|---|---|---|---|
| Lundstrom Monica | $132,000 | None Available | |
| Anderson Lori | -- | None Available | |
| Anderson Timothy | $129,000 | -- |
Source: Public Records
Mortgage History
| Date | Status | Borrower | Loan Amount |
|---|---|---|---|
| Open | Lundstrom Monica | $125,400 | |
| Previous Owner | Anderson Lori | $122,000 | |
| Previous Owner | Anderson Timothy | $125,372 |
Source: Public Records
Tax History Compared to Growth
Tax History
| Year | Tax Paid | Tax Assessment Tax Assessment Total Assessment is a certain percentage of the fair market value that is determined by local assessors to be the total taxable value of land and additions on the property. | Land | Improvement |
|---|---|---|---|---|
| 2025 | $3,720 | $241,500 | $53,500 | $188,000 |
| 2024 | $3,720 | $199,600 | $49,500 | $150,100 |
| 2023 | $3,410 | $199,600 | $49,500 | $150,100 |
| 2022 | $3,382 | $153,600 | $39,200 | $114,400 |
| 2021 | $3,582 | $153,600 | $39,200 | $114,400 |
| 2020 | $3,714 | $152,100 | $38,800 | $113,300 |
| 2019 | $3,512 | $152,100 | $38,800 | $113,300 |
| 2018 | $3,472 | $139,200 | $34,900 | $104,300 |
| 2017 | $3,404 | $139,200 | $34,900 | $104,300 |
| 2016 | $3,312 | $134,400 | $33,100 | $101,300 |
| 2015 | $3,312 | $134,400 | $33,100 | $101,300 |
| 2014 | $1,714 | $146,300 | $35,300 | $111,000 |
Source: Public Records
Map
Nearby Homes
- 1231 Jerlynn Ave
- 4031 E 8th St
- 1022 Trisha Ave
- 4021 E 14th St
- 1140 NE 43rd Ave
- 3723 Wright St
- 3704 Wright St
- 3623 Wright St
- 3823 Bowdoin St
- 3832 Bowdoin St
- 3701 Amherst St
- 360 & 340 NE Aurora Ave
- 4033 Cambridge St
- 3421 Amherst St
- 3507 Bowdoin St
- 139 E Seneca Ave
- 3409 Bowdoin St
- 3623 Cambridge St
- 3215 E 8th St
- 3615 Cambridge St
- 1204 Jerlynn Ave
- 1212 Jerlynn Ave
- 1124 Jerlynn Ave
- 1216 Jerlynn Ave
- 1017 E Shawnee Ave
- 1021 E Shawnee Ave
- 1013 E Shawnee Ave
- 1027 E Shawnee Ave
- 1207 Jerlynn Ave
- 1007 E Shawnee Ave
- 1211 Jerlynn Ave
- 1203 Jerlynn Ave
- 4025 E 10th St
- 1220 Jerlynn Ave
- 1031 E Shawnee Ave
- 1215 Jerlynn Ave
- 4037 E 10th St
- 1035 E Shawnee Ave
- 1219 Jerlynn Ave
- 1232 Jerlynn Ave