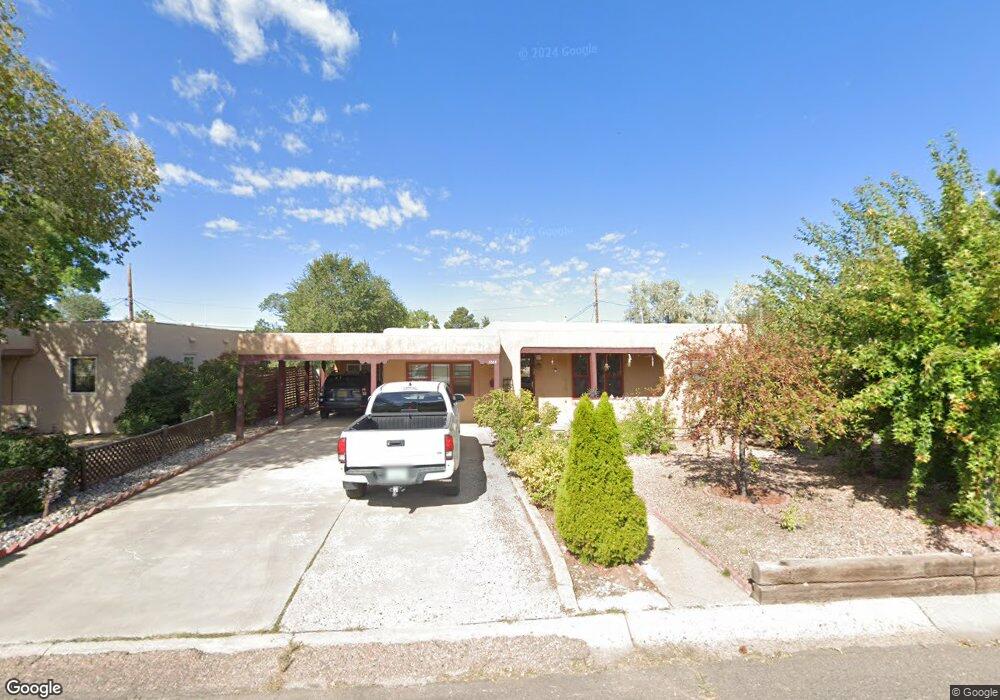
1208 Morelia St Santa Fe, NM 87505
San Mateo NeighborhoodEstimated Value: $458,000 - $625,125
3
Beds
2
Baths
1,134
Sq Ft
$477/Sq Ft
Est. Value
About This Home
This home is located at 1208 Morelia St, Santa Fe, NM 87505 and is currently estimated at $540,781, approximately $476 per square foot. 1208 Morelia St is a home located in Santa Fe County with nearby schools including E.J. Martinez Elementary School, Santa Fe High School, and Santa Fe Secondary School.
Ownership History
Date
Name
Owned For
Owner Type
Purchase Details
Closed on
Apr 13, 2017
Sold by
Goshar Tashi Youdon
Bought by
Goshar Tashi Youdan
Current Estimated Value
Purchase Details
Closed on
Mar 26, 2013
Sold by
Goshar Tashi Y and Youdon Goshar Tashi
Bought by
Goshar Tashi Y
Home Financials for this Owner
Home Financials are based on the most recent Mortgage that was taken out on this home.
Original Mortgage
$228,000
Outstanding Balance
$161,809
Interest Rate
3.59%
Mortgage Type
New Conventional
Estimated Equity
$378,972
Purchase Details
Closed on
Aug 31, 2010
Sold by
Youdon Tashi
Bought by
Youdon Goshar Tashi
Purchase Details
Closed on
May 20, 2010
Sold by
Martinez Joseph M
Bought by
Youdon Tashi
Home Financials for this Owner
Home Financials are based on the most recent Mortgage that was taken out on this home.
Original Mortgage
$236,800
Interest Rate
5.14%
Mortgage Type
New Conventional
Create a Home Valuation Report for This Property
The Home Valuation Report is an in-depth analysis detailing your home's value as well as a comparison with similar homes in the area
Home Values in the Area
Average Home Value in this Area
Purchase History
| Date | Buyer | Sale Price | Title Company |
|---|---|---|---|
| Goshar Tashi Youdan | -- | None Available | |
| Goshar Tashi Y | -- | None Available | |
| Youdon Goshar Tashi | -- | Accommodation | |
| Youdon Tashi | -- | St&E |
Source: Public Records
Mortgage History
| Date | Status | Borrower | Loan Amount |
|---|---|---|---|
| Open | Goshar Tashi Y | $228,000 | |
| Closed | Youdon Tashi | $236,800 |
Source: Public Records
Tax History Compared to Growth
Tax History
| Year | Tax Paid | Tax Assessment Tax Assessment Total Assessment is a certain percentage of the fair market value that is determined by local assessors to be the total taxable value of land and additions on the property. | Land | Improvement |
|---|---|---|---|---|
| 2024 | $2,143 | $287,176 | $152,981 | $134,195 |
| 2023 | $2,141 | $278,813 | $148,526 | $130,287 |
| 2022 | $2,093 | $270,693 | $144,200 | $126,493 |
| 2021 | $2,059 | $87,603 | $46,666 | $40,937 |
| 2020 | $1,996 | $85,052 | $46,666 | $38,386 |
| 2019 | $1,966 | $82,575 | $46,093 | $36,482 |
| 2018 | $1,922 | $80,170 | $44,751 | $35,419 |
| 2017 | $1,872 | $77,835 | $43,448 | $34,387 |
| 2016 | $1,764 | $75,569 | $42,183 | $33,386 |
| 2015 | $1,721 | $73,368 | $40,955 | $32,413 |
| 2014 | $1,617 | $71,160 | $33,588 | $37,572 |
Source: Public Records
Map
Nearby Homes
- 323 W Cordova Rd
- 1043 W Don Diego Ave Unit E
- 1200 Galisteo Pkwy
- 309 Lomita St
- 1022 Don Diego Ave Unit D
- 1110 Galisteo St
- 622 Calle Grillo
- 166 Galisteo Ln
- 138 W Coronado Rd
- 908 Galisteo St
- 901 Galisteo St
- 845 Gilmore St
- 134 W Houghton St Unit D
- 730 Columbia St Unit B
- 730 Columbia St Unit D
- 1011 Don Gaspar Ave
- 114B Valencia Rd
- 29 Sena St Unit Lot 5
- 315 Sena St
- 132 La Placita Cir
- 1212 Morelia St
- 1204 Morelia St
- 1207 Don Diego Ave
- 1216 Morelia St
- 400 W Cordova Rd
- 1211 Don Diego Ave
- 1203 Don Diego Ave
- 1207 Morelia St
- 1203 Morelia St
- 1211 Morelia St
- 1215 Don Diego Ave
- 1201 Don Diego Ave
- 1220 Morelia St
- 1215 Morelia St
- 310 W Cordova Rd
- 1219 Don Diego Ave
- 1219 Morelia St
- 1208 Don Diego Ave
- 1208 Escalante St
- 1212 Don Diego Ave