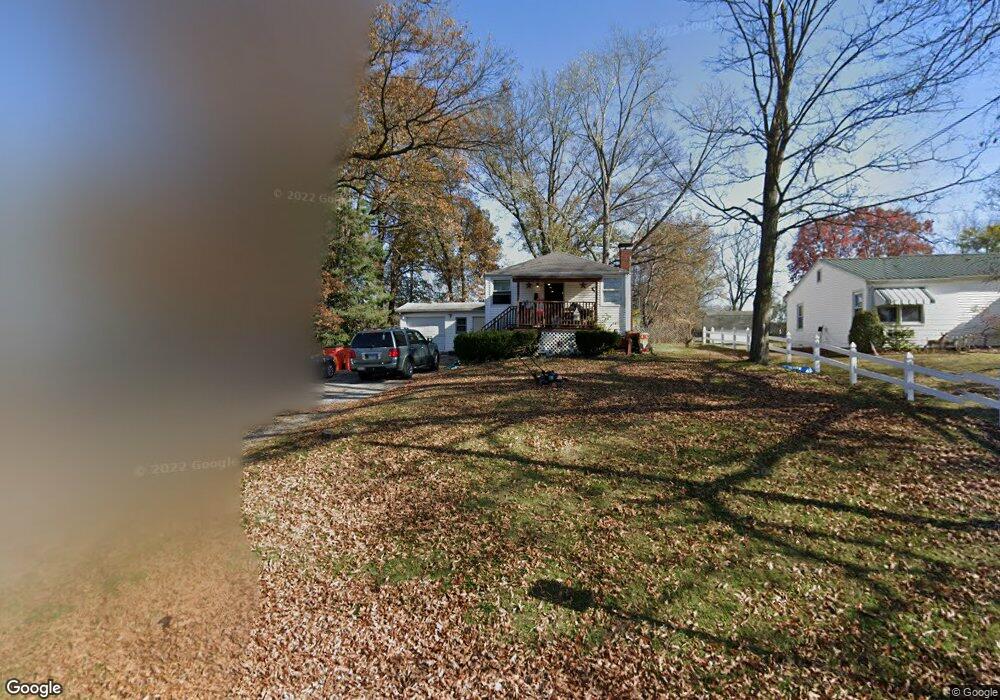
1208 S 3rd St Effingham, IL 62401
Estimated Value: $126,062 - $352,000
2
Beds
1
Bath
800
Sq Ft
$230/Sq Ft
Est. Value
About This Home
This home is located at 1208 S 3rd St, Effingham, IL 62401 and is currently estimated at $184,016, approximately $230 per square foot. 1208 S 3rd St is a home located in Effingham County with nearby schools including South Side Grade School, Early Learning Center, and Central Grade School.
Ownership History
Date
Name
Owned For
Owner Type
Purchase Details
Closed on
Jan 11, 2023
Sold by
Feldkamp Alex
Bought by
Feldkamp Alex
Current Estimated Value
Home Financials for this Owner
Home Financials are based on the most recent Mortgage that was taken out on this home.
Original Mortgage
$50,875
Outstanding Balance
$49,199
Interest Rate
6.25%
Mortgage Type
FHA
Estimated Equity
$134,817
Purchase Details
Closed on
Jan 16, 2014
Sold by
The Secretary Of Veterans Affairs
Bought by
Feldkamp Todd and Fledkamp Alex
Purchase Details
Closed on
May 8, 2013
Sold by
Bowman Jerry D
Bought by
Secretary Of Veterans Affairs
Create a Home Valuation Report for This Property
The Home Valuation Report is an in-depth analysis detailing your home's value as well as a comparison with similar homes in the area
Home Values in the Area
Average Home Value in this Area
Purchase History
| Date | Buyer | Sale Price | Title Company |
|---|---|---|---|
| Feldkamp Alex | -- | Vantage Point Title Inc | |
| Feldkamp Todd | -- | Community Title Shiloh Llc | |
| Secretary Of Veterans Affairs | $29,964 | None Available |
Source: Public Records
Mortgage History
| Date | Status | Borrower | Loan Amount |
|---|---|---|---|
| Open | Feldkamp Alex | $50,875 |
Source: Public Records
Tax History
| Year | Tax Paid | Tax Assessment Tax Assessment Total Assessment is a certain percentage of the fair market value that is determined by local assessors to be the total taxable value of land and additions on the property. | Land | Improvement |
|---|---|---|---|---|
| 2024 | $2,156 | $31,920 | $12,690 | $19,230 |
| 2023 | $1,976 | $29,020 | $11,540 | $17,480 |
| 2022 | $1,855 | $26,630 | $10,590 | $16,040 |
| 2021 | $1,913 | $26,370 | $10,490 | $15,880 |
| 2020 | $1,878 | $25,620 | $10,190 | $15,430 |
| 2019 | $1,842 | $25,370 | $10,090 | $15,280 |
| 2018 | $1,782 | $24,390 | $9,700 | $14,690 |
| 2017 | $1,752 | $23,910 | $9,510 | $14,400 |
| 2016 | $1,715 | $23,210 | $9,230 | $13,980 |
| 2015 | -- | $22,530 | $8,960 | $13,570 |
| 2014 | -- | $21,870 | $8,700 | $13,170 |
| 2013 | -- | $21,440 | $8,530 | $12,910 |
| 2012 | -- | $21,120 | $8,400 | $12,720 |
Source: Public Records
Map
Nearby Homes
- 1307 S 3rd St
- 308 E Kreke Ave
- 202 E Eiche Ave
- 1005 S 3rd St
- 906 S 3rd St
- 806 S 4th St
- 306 W Wabash Ave
- 103 W Kagay Ave
- 105 W Kagay Ave
- 310 W Kagay Ave
- 602 S 5th St
- 504 A&B E Hendelmeyer Ave Unit B
- 921 Lynn Dr
- 602 S Linden St
- 401 S Walnut St
- 104 S Willow St
- 507 E Jefferson Ave
- 710 W Richland Ave
- 702 W Fayette Ave
- 203 S Mulberry St
Your Personal Tour Guide
Ask me questions while you tour the home.