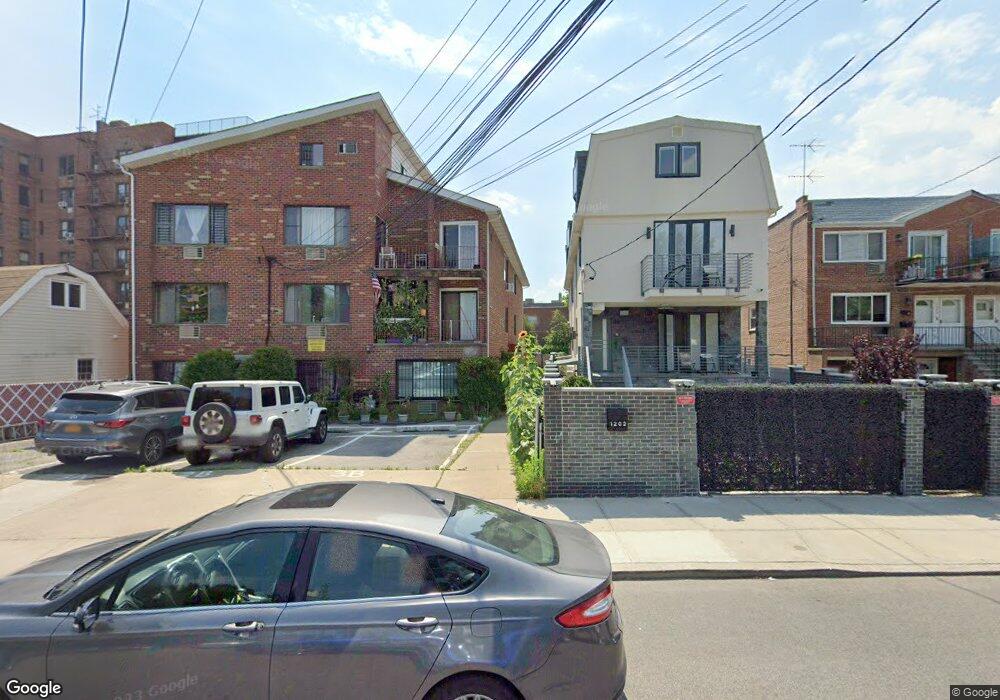
1208 Sheepshead Bay Rd Unit 3A Brooklyn, NY 11235
Sheepshead Bay NeighborhoodEstimated Value: $422,000 - $653,000
2
Beds
1
Bath
1,121
Sq Ft
$515/Sq Ft
Est. Value
About This Home
This home is located at 1208 Sheepshead Bay Rd Unit 3A, Brooklyn, NY 11235 and is currently estimated at $577,163, approximately $514 per square foot. 1208 Sheepshead Bay Rd Unit 3A is a home located in Kings County with nearby schools including P.S. 209 Margaret Mead, P.S. K225 - The Eileen E. Zaglin School, and Ahi Ezer Yeshiva School.
Ownership History
Date
Name
Owned For
Owner Type
Purchase Details
Closed on
Nov 9, 2018
Sold by
Slukhinska Olga and Slukhinsky Arkady
Bought by
Gribushin Igor V and Zilber Svetlana
Current Estimated Value
Home Financials for this Owner
Home Financials are based on the most recent Mortgage that was taken out on this home.
Original Mortgage
$565,000
Outstanding Balance
$496,804
Interest Rate
4.8%
Mortgage Type
New Conventional
Estimated Equity
$80,359
Purchase Details
Closed on
Aug 27, 2003
Sold by
Mvrs Building Corp
Bought by
Slukhinska Olga and Slukhinsky Arkady
Home Financials for this Owner
Home Financials are based on the most recent Mortgage that was taken out on this home.
Original Mortgage
$277,200
Interest Rate
5.82%
Mortgage Type
Purchase Money Mortgage
Create a Home Valuation Report for This Property
The Home Valuation Report is an in-depth analysis detailing your home's value as well as a comparison with similar homes in the area
Home Values in the Area
Average Home Value in this Area
Purchase History
| Date | Buyer | Sale Price | Title Company |
|---|---|---|---|
| Gribushin Igor V | $606,000 | -- | |
| Gribushin Igor V | $606,000 | -- | |
| Slukhinska Olga | $315,000 | -- | |
| Slukhinska Olga | $315,000 | -- |
Source: Public Records
Mortgage History
| Date | Status | Borrower | Loan Amount |
|---|---|---|---|
| Open | Gribushin Igor V | $565,000 | |
| Closed | Gribushin Igor V | $565,000 | |
| Previous Owner | Slukhinska Olga | $277,200 |
Source: Public Records
Tax History Compared to Growth
Tax History
| Year | Tax Paid | Tax Assessment Tax Assessment Total Assessment is a certain percentage of the fair market value that is determined by local assessors to be the total taxable value of land and additions on the property. | Land | Improvement |
|---|---|---|---|---|
| 2025 | $6,510 | $51,630 | $10,641 | $40,989 |
| 2024 | $6,510 | $57,661 | $10,641 | $47,020 |
| 2023 | $4,595 | $54,741 | $10,641 | $44,100 |
| 2022 | $4,278 | $48,634 | $10,641 | $37,993 |
| 2021 | $4,127 | $46,790 | $10,641 | $36,149 |
| 2020 | $2,842 | $47,673 | $10,641 | $37,032 |
| 2019 | $5,489 | $47,673 | $10,641 | $37,032 |
| 2018 | $1,901 | $48,326 | $10,641 | $37,685 |
| 2017 | $3,706 | $44,100 | $10,641 | $33,459 |
| 2016 | $1,617 | $42,987 | $10,641 | $32,346 |
| 2015 | $2,310 | $34,535 | $10,641 | $23,894 |
| 2014 | $2,310 | $30,386 | $10,641 | $19,745 |
Source: Public Records
Map
Nearby Homes
- 1208 Sheepshead Bay Rd Unit 2B
- 2481 E 13th St
- 1260 Avenue Y Unit 2A
- 1220 Avenue Y Unit OA
- 2509 E 12th St Unit 103B
- 1163 Sheepshead Bay Rd
- 2408 E 13th St
- 2441A E 14th St
- 2475 E 11th St Unit 6F
- 2546 E 13th St Unit F7
- 2546 E 13th St Unit D9
- 2546 E 13th St Unit A11
- 2546 E 13th St Unit L14
- 2546 E 13th St Unit E1
- 2546 E 13th St Unit D7
- 2478 E 11th St Unit 2CC
- 2478 E 11th St Unit 2C
- 1213 Avenue Z Unit E37
- 1213 Avenue Z Unit C39
- 1213 Avenue Z Unit F33
- 1208 Sheepshead Bay Rd Unit 3D
- 1208 Sheepshead Bay Rd Unit 3C
- 1208 Sheepshead Bay Rd Unit 3B
- 1208 Sheepshead Bay Rd Unit 2D
- 1208 Sheepshead Bay Rd Unit 2C
- 1208 Sheepshead Bay Rd Unit 2A
- 1208 Sheepshead Bay Rd Unit 1D
- 1208 Sheepshead Bay Rd Unit 1C
- 1208 Sheepshead Bay Rd Unit 1B
- 1208 Sheepshead Bay Rd Unit 1A
- 1208 Sheepshead Bay Rd Unit 2A
- 1208 Sheepshead Bay Rd
- 1202 Sheepshead Bay Rd
- 1210 Sheepshead Bay Rd
- 1200 Sheepshead Bay Rd
- 1216 Sheepshead Bay Rd
- 1198 Sheepshead Bay Rd
- 1241 Avenue Y
- 1190 Sheepshead Bay Rd
- 1247 Avenue Y