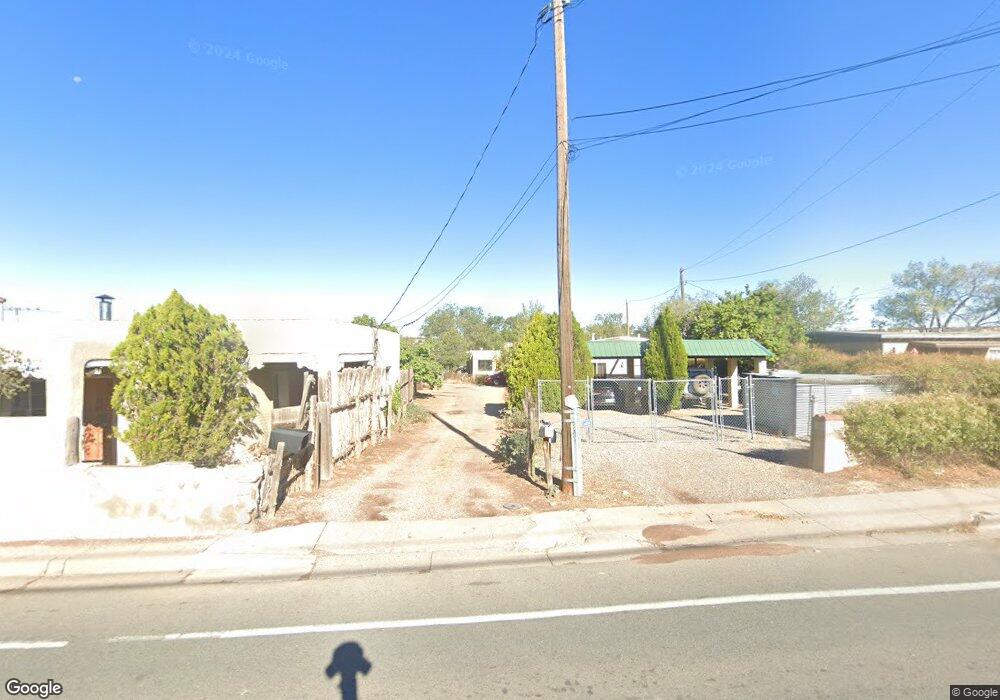
1209 Agua Fria St Santa Fe, NM 87501
La Madera NeighborhoodEstimated Value: $385,000 - $455,823
2
Beds
1
Bath
960
Sq Ft
$432/Sq Ft
Est. Value
About This Home
This home is located at 1209 Agua Fria St, Santa Fe, NM 87501 and is currently estimated at $414,706, approximately $431 per square foot. 1209 Agua Fria St is a home located in Santa Fe County with nearby schools including Aspen Community Magnet School, Capital High School, and Dragonfly School.
Ownership History
Date
Name
Owned For
Owner Type
Purchase Details
Closed on
Aug 4, 2020
Sold by
Silva Julian R and Silva Janet D
Bought by
Cook Matthew W and Kelley Sherry M
Current Estimated Value
Home Financials for this Owner
Home Financials are based on the most recent Mortgage that was taken out on this home.
Original Mortgage
$250,000
Outstanding Balance
$222,177
Interest Rate
3.1%
Mortgage Type
Commercial
Estimated Equity
$192,529
Purchase Details
Closed on
Jul 17, 2020
Sold by
Silva Anthony J
Bought by
Silva Julian R
Home Financials for this Owner
Home Financials are based on the most recent Mortgage that was taken out on this home.
Original Mortgage
$250,000
Outstanding Balance
$222,177
Interest Rate
3.1%
Mortgage Type
Commercial
Estimated Equity
$192,529
Purchase Details
Closed on
Dec 5, 2019
Sold by
Silva Julian R and Silva Patrick T
Bought by
Silva Julian R
Purchase Details
Closed on
Jun 8, 2011
Sold by
Silva Julian R
Bought by
Silva Julian R and Silva Patrick T
Create a Home Valuation Report for This Property
The Home Valuation Report is an in-depth analysis detailing your home's value as well as a comparison with similar homes in the area
Home Values in the Area
Average Home Value in this Area
Purchase History
| Date | Buyer | Sale Price | Title Company |
|---|---|---|---|
| Cook Matthew W | -- | Prima Title Llc | |
| Silva Julian R | -- | None Available | |
| Silva Julian R | -- | None Available | |
| Silva Julian R | -- | None Available |
Source: Public Records
Mortgage History
| Date | Status | Borrower | Loan Amount |
|---|---|---|---|
| Open | Cook Matthew W | $250,000 |
Source: Public Records
Tax History Compared to Growth
Tax History
| Year | Tax Paid | Tax Assessment Tax Assessment Total Assessment is a certain percentage of the fair market value that is determined by local assessors to be the total taxable value of land and additions on the property. | Land | Improvement |
|---|---|---|---|---|
| 2024 | $1,899 | $249,252 | $93,354 | $155,898 |
| 2023 | $1,899 | $241,993 | $90,635 | $151,358 |
| 2022 | $1,857 | $234,945 | $80,000 | $154,945 |
| 2021 | $1,909 | $79,354 | $24,999 | $54,355 |
| 2020 | $996 | $41,444 | $16,511 | $24,933 |
| 2019 | $982 | $40,237 | $16,030 | $24,207 |
| 2018 | $960 | $39,065 | $15,563 | $23,502 |
| 2017 | $936 | $37,928 | $15,110 | $22,818 |
| 2016 | $883 | $36,824 | $14,671 | $22,153 |
| 2015 | $862 | $35,752 | $14,244 | $21,508 |
| 2014 | $811 | $34,676 | $13,816 | $20,860 |
Source: Public Records
Map
Nearby Homes
- 1217 Agua Fria St
- 1428 1/2 Hickox St
- 1536 1/2 Hickox St
- 1530 Hickox St
- 630 Alicia St
- 1022 Lopez St
- 945 Agua Fria St
- 506 Onate Place
- 125 Mesa Vista St
- 903 Agua Fria St
- 816 Baca St
- 116 Moore St
- 543 Juanita St Unit B
- 842 W Manhattan Ave
- 1710 W Alameda St Unit 7
- 1701 W Alameda St
- 927 Alto St Unit B
- 0 Aqua Fria Unit 202504577
- 1701 Paseo de Peralta
- 131 Spruce St
- 1211 Agua Fria St Unit B
- 1211 Agua Fria St
- 1211 Agua Fria St
- 1203 Agua Fria St
- 1203 Agua Fria St
- 1203 Agua Fria St Unit A
- 1203 Agua Fria St Unit B
- 1207 Agua Fria St
- 1205 Agua Fria St
- 435 Camino Alire
- 1213 Agua Fria St
- 435 1/2 Camino Alire
- 431 Camino Alire
- 1204 Agua Fria St
- 1123 Agua Fria St
- 501 Errett St
- 1206 Agua Fria St
- 1212 Agua Fria St
- 0 Agua Fria St Unit 201301776
- 0 Agua Fria St Unit 201301780