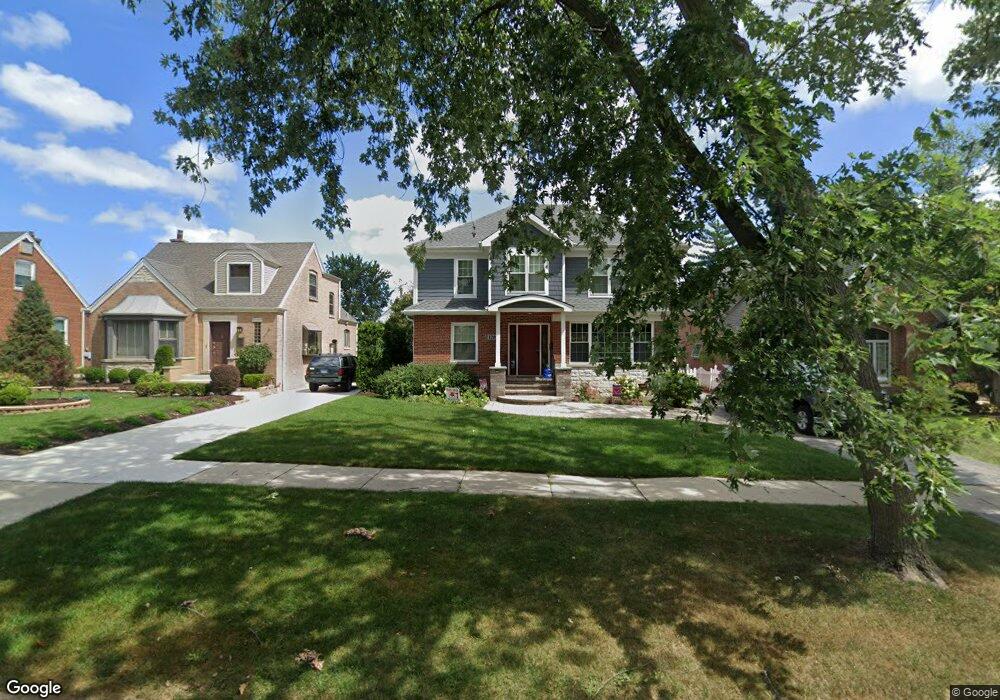
1209 Grove Ave Park Ridge, IL 60068
O'Hare NeighborhoodEstimated Value: $442,000 - $732,618
--
Bed
5
Baths
2,851
Sq Ft
$217/Sq Ft
Est. Value
About This Home
This home is located at 1209 Grove Ave, Park Ridge, IL 60068 and is currently estimated at $618,905, approximately $217 per square foot. 1209 Grove Ave is a home located in Cook County with nearby schools including Theodore Roosevelt Elementary School, Lincoln Middle School, and Maine South High School.
Ownership History
Date
Name
Owned For
Owner Type
Purchase Details
Closed on
Mar 28, 2001
Sold by
Vignoli Franco
Bought by
Rutherford Craig and Rutherford Robyn
Current Estimated Value
Home Financials for this Owner
Home Financials are based on the most recent Mortgage that was taken out on this home.
Original Mortgage
$250,000
Interest Rate
7.62%
Purchase Details
Closed on
Feb 8, 2000
Sold by
American National Bk & Tr Co Of Chicago
Bought by
Zulewski Andy
Home Financials for this Owner
Home Financials are based on the most recent Mortgage that was taken out on this home.
Original Mortgage
$266,250
Interest Rate
10.5%
Purchase Details
Closed on
Jun 25, 1998
Sold by
Bez James M and Goble Bez Sharon A
Bought by
Labree Paula and Concept One Profit Sharing Plan & Trust
Home Financials for this Owner
Home Financials are based on the most recent Mortgage that was taken out on this home.
Original Mortgage
$188,000
Interest Rate
8.5%
Create a Home Valuation Report for This Property
The Home Valuation Report is an in-depth analysis detailing your home's value as well as a comparison with similar homes in the area
Home Values in the Area
Average Home Value in this Area
Purchase History
| Date | Buyer | Sale Price | Title Company |
|---|---|---|---|
| Rutherford Craig | $362,500 | -- | |
| Zulewski Andy | -- | -- | |
| Labree Paula | $235,000 | Chicago Title Insurance Co |
Source: Public Records
Mortgage History
| Date | Status | Borrower | Loan Amount |
|---|---|---|---|
| Previous Owner | Rutherford Craig | $250,000 | |
| Previous Owner | Zulewski Andy | $266,250 | |
| Previous Owner | Labree Paula | $188,000 |
Source: Public Records
Tax History Compared to Growth
Tax History
| Year | Tax Paid | Tax Assessment Tax Assessment Total Assessment is a certain percentage of the fair market value that is determined by local assessors to be the total taxable value of land and additions on the property. | Land | Improvement |
|---|---|---|---|---|
| 2024 | $15,458 | $60,749 | $11,130 | $49,619 |
| 2023 | $14,790 | $60,749 | $11,130 | $49,619 |
| 2022 | $14,790 | $60,749 | $11,130 | $49,619 |
| 2021 | $9,321 | $34,236 | $8,347 | $25,889 |
| 2020 | $9,074 | $34,236 | $8,347 | $25,889 |
| 2019 | $8,753 | $37,126 | $8,347 | $28,779 |
| 2018 | $7,470 | $29,757 | $6,956 | $22,801 |
| 2017 | $5,969 | $24,573 | $6,956 | $17,617 |
| 2016 | $5,983 | $24,573 | $6,956 | $17,617 |
| 2015 | $5,759 | $21,521 | $1,391 | $20,130 |
| 2014 | $5,661 | $21,521 | $1,391 | $20,130 |
| 2013 | $5,813 | $23,176 | $5,962 | $17,214 |
Source: Public Records
Map
Nearby Homes
- 1220 Canfield Rd
- 1021 Cleveland Ave
- 7725 W Myrtle Ave
- 7740 W Norwood St
- 1220 Courtland Ave
- 718 S Washington Ave
- 7425 W Devon Ave
- 1729 Linden Ave
- 1632 S Vine Ave
- 1705 S Crescent Ave
- 6681 N Northwest Hwy
- 6815 N Olmsted Ave Unit 203
- 6625 N Northwest Hwy Unit 202
- 7744 W Thorndale Ave
- 6524 N Northwest Hwy Unit A
- 7811 W Thorndale Ave
- 6852 N Northwest Hwy Unit 2B
- 6858 N Northwest Hwy Unit 2E
- 1425 Brophy Ave
- 6841 N Northwest Hwy Unit 3C
- 1205 Grove Ave
- 1213 Grove Ave
- 1217 Grove Ave
- 1201 Grove Ave
- 1221 Grove Ave
- 1212 Canfield Rd
- 1208 Canfield Rd
- 1216 Canfield Rd
- 1 W Devon Ave
- 1225 Grove Ave
- 1208 Grove Ave
- 1204 Grove Ave
- 1128 Cleveland Ave
- 1224 Canfield Rd
- 22 Devon Ave
- 1212 Grove Ave
- 1200 Grove Ave
- 1229 Grove Ave
- 1216 Grove Ave
- 1127 Cleveland Ave