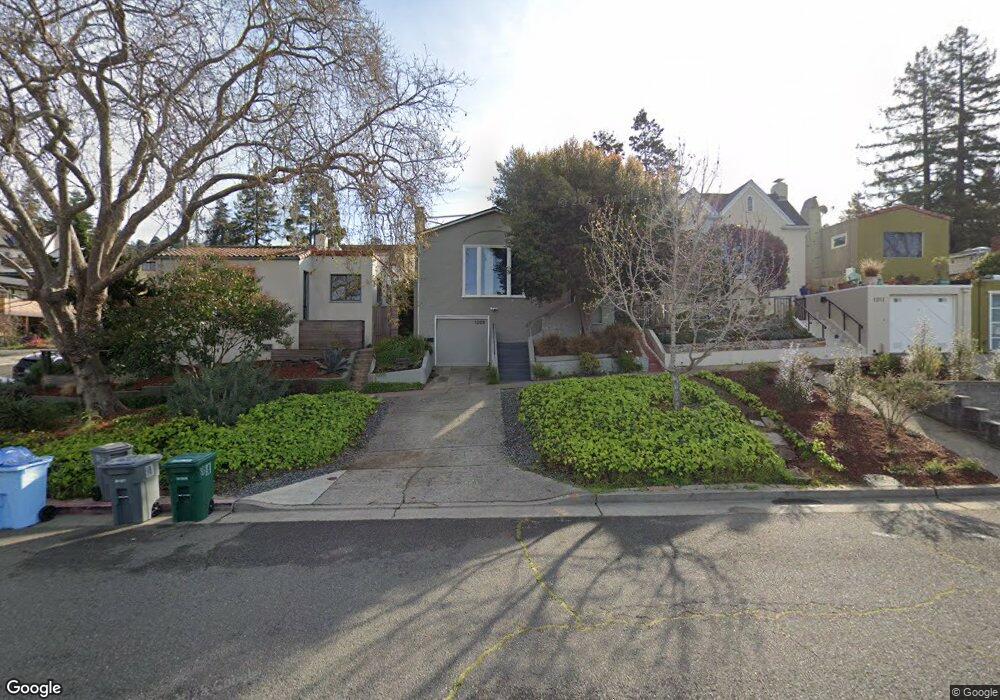
1209 Henry St Berkeley, CA 94709
North Berkeley NeighborhoodEstimated Value: $1,307,000 - $1,686,000
2
Beds
1
Bath
1,162
Sq Ft
$1,212/Sq Ft
Est. Value
About This Home
This home is located at 1209 Henry St, Berkeley, CA 94709 and is currently estimated at $1,407,879, approximately $1,211 per square foot. 1209 Henry St is a home located in Alameda County with nearby schools including Berkeley Arts Magnet at Whittier School, Cragmont Elementary School, and Washington Elementary School.
Ownership History
Date
Name
Owned For
Owner Type
Purchase Details
Closed on
Jan 6, 2011
Sold by
Espinoza Jacqueline and Ramirez Steven J
Bought by
Espinoza Jacqueline and Ramirez Steven J
Current Estimated Value
Purchase Details
Closed on
Oct 11, 2002
Sold by
Sanaee Anusheh
Bought by
Ramirez Steven J and Espinoza Jacqueline
Home Financials for this Owner
Home Financials are based on the most recent Mortgage that was taken out on this home.
Original Mortgage
$340,000
Outstanding Balance
$141,395
Interest Rate
6.05%
Mortgage Type
Stand Alone First
Estimated Equity
$1,266,484
Purchase Details
Closed on
Jun 28, 1999
Sold by
Thiers Gerald R and Thiers Rosa L
Bought by
Sanaee Anusheh
Home Financials for this Owner
Home Financials are based on the most recent Mortgage that was taken out on this home.
Original Mortgage
$276,800
Interest Rate
6.37%
Purchase Details
Closed on
Aug 8, 1997
Sold by
Thiers Gerald R and Thiers Rosa L
Bought by
Thiers Gerald Raymond and Thiers Rosa Lee
Create a Home Valuation Report for This Property
The Home Valuation Report is an in-depth analysis detailing your home's value as well as a comparison with similar homes in the area
Home Values in the Area
Average Home Value in this Area
Purchase History
| Date | Buyer | Sale Price | Title Company |
|---|---|---|---|
| Espinoza Jacqueline | -- | None Available | |
| Ramirez Steven J | $425,000 | First American Title Guarant | |
| Sanaee Anusheh | $346,000 | First American Title Guarant | |
| Thiers Gerald Raymond | -- | -- |
Source: Public Records
Mortgage History
| Date | Status | Borrower | Loan Amount |
|---|---|---|---|
| Open | Ramirez Steven J | $340,000 | |
| Previous Owner | Sanaee Anusheh | $276,800 |
Source: Public Records
Tax History
| Year | Tax Paid | Tax Assessment Tax Assessment Total Assessment is a certain percentage of the fair market value that is determined by local assessors to be the total taxable value of land and additions on the property. | Land | Improvement |
|---|---|---|---|---|
| 2025 | $9,991 | $615,484 | $184,645 | $430,839 |
| 2024 | $9,991 | $603,418 | $181,025 | $422,393 |
| 2023 | $9,778 | $591,591 | $177,477 | $414,114 |
| 2022 | $9,591 | $579,992 | $173,997 | $405,995 |
| 2021 | $9,606 | $568,624 | $170,587 | $398,037 |
| 2020 | $9,062 | $562,797 | $168,839 | $393,958 |
| 2019 | $8,675 | $551,764 | $165,529 | $386,235 |
| 2018 | $8,523 | $540,947 | $162,284 | $378,663 |
| 2017 | $8,221 | $530,344 | $159,103 | $371,241 |
| 2016 | $7,936 | $519,948 | $155,984 | $363,964 |
| 2015 | $7,828 | $512,141 | $153,642 | $358,499 |
| 2014 | $7,766 | $502,111 | $150,633 | $351,478 |
Source: Public Records
Map
Nearby Homes
- 2012 Rose St
- 1809 Hopkins St
- 1444 Walnut St
- 1425 Martin Luther King jr Way
- 1471 Scenic Ave
- 1610 Milvia St
- 1609 Bonita Ave Unit 3
- 1609 Bonita Ave Unit 5
- 826 Indian Rock Ave
- 1136 Keith Ave
- 2201 Virginia St Unit 2
- 1106 Cragmont Ave
- 2340 Virginia St
- 2015 Delaware St
- 2015 Delaware St Unit A
- 1024 Miller Ave
- 1983 Yosemite Rd
- 770 Santa Barbara Rd
- 1165 Cragmont Ave
- 2451 Le Conte Ave
- 1211 Henry St
- 2030 Eunice St
- 1213 Henry St
- 2034 Eunice St
- 1215 Henry St
- 2036 Eunice St
- 2061 Eunice St
- 1217 Henry St
- 1208 Shattuck Ave
- 1200 Shattuck Ave
- 1197 Sutter St
- 1210 Shattuck Ave
- 1223 Henry St
- 2044 Eunice St
- 1195 Sutter St
- 1212 Shattuck Ave
- 1191 Sutter St
- 2081 Eunice St
- 1222 Shattuck Ave
- 1218 Shattuck Ave
Your Personal Tour Guide
Ask me questions while you tour the home.