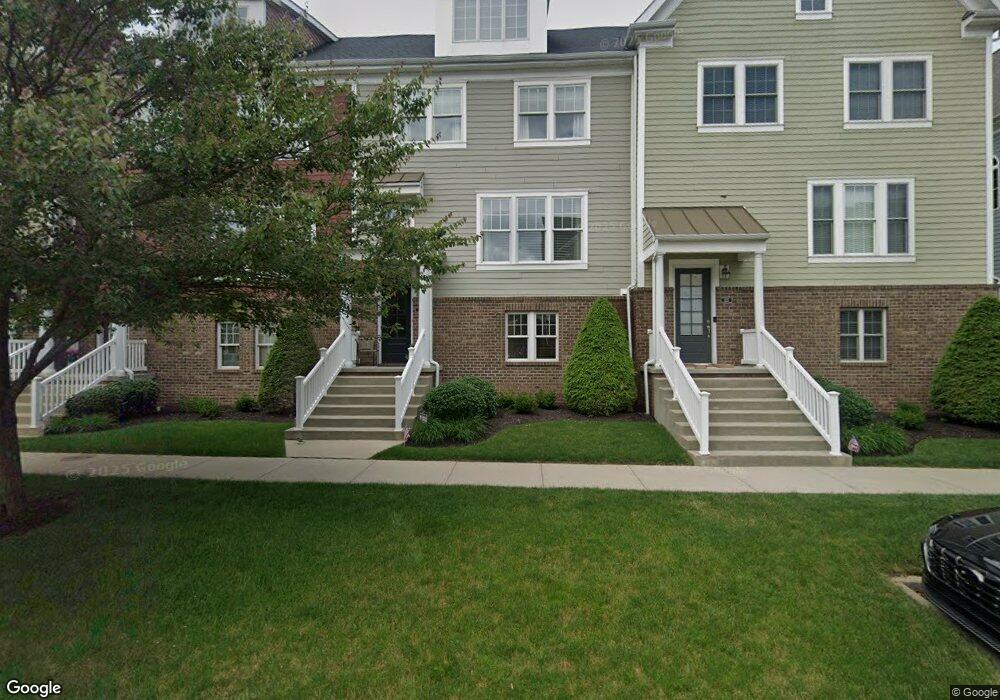
121 3rd St Oakmont, PA 15139
Estimated Value: $600,000 - $679,000
3
Beds
3
Baths
2,309
Sq Ft
$279/Sq Ft
Est. Value
About This Home
This home is located at 121 3rd St, Oakmont, PA 15139 and is currently estimated at $643,238, approximately $278 per square foot. 121 3rd St is a home with nearby schools including Riverview High School.
Ownership History
Date
Name
Owned For
Owner Type
Purchase Details
Closed on
Jun 17, 2024
Sold by
Knight Dallas L and Knight Susan E
Bought by
Knight Family Protector Trust and Knight
Current Estimated Value
Purchase Details
Closed on
May 15, 2024
Sold by
Knight Dallas L and Knight Susan E
Bought by
Knight Family Protector Trust
Purchase Details
Closed on
Jun 14, 2013
Sold by
Nvr Inc
Bought by
Knight Dallas L
Home Financials for this Owner
Home Financials are based on the most recent Mortgage that was taken out on this home.
Original Mortgage
$175,000
Interest Rate
3.45%
Mortgage Type
New Conventional
Create a Home Valuation Report for This Property
The Home Valuation Report is an in-depth analysis detailing your home's value as well as a comparison with similar homes in the area
Home Values in the Area
Average Home Value in this Area
Purchase History
| Date | Buyer | Sale Price | Title Company |
|---|---|---|---|
| Knight Family Protector Trust | -- | -- | |
| Knight Family Protector Trust | -- | -- | |
| Knight Dallas L | $363,048 | -- |
Source: Public Records
Mortgage History
| Date | Status | Borrower | Loan Amount |
|---|---|---|---|
| Previous Owner | Knight Dallas L | $175,000 |
Source: Public Records
Tax History Compared to Growth
Tax History
| Year | Tax Paid | Tax Assessment Tax Assessment Total Assessment is a certain percentage of the fair market value that is determined by local assessors to be the total taxable value of land and additions on the property. | Land | Improvement |
|---|---|---|---|---|
| 2025 | $11,247 | $345,000 | $39,900 | $305,100 |
| 2024 | $11,247 | $345,000 | $39,900 | $305,100 |
| 2023 | $11,084 | $345,000 | $39,900 | $305,100 |
| 2022 | $10,948 | $345,000 | $39,900 | $305,100 |
| 2021 | $1,632 | $345,000 | $39,900 | $305,100 |
| 2020 | $10,948 | $345,000 | $39,900 | $305,100 |
| 2019 | $10,856 | $345,000 | $39,900 | $305,100 |
| 2018 | $3,357 | $345,000 | $39,900 | $305,100 |
| 2017 | $11,219 | $363,000 | $39,900 | $323,100 |
| 2016 | $1,717 | $363,000 | $39,900 | $323,100 |
| 2015 | $1,717 | $201,450 | $39,900 | $161,550 |
| 2014 | $6,160 | $158,600 | $31,500 | $127,100 |
Source: Public Records
Map
Nearby Homes