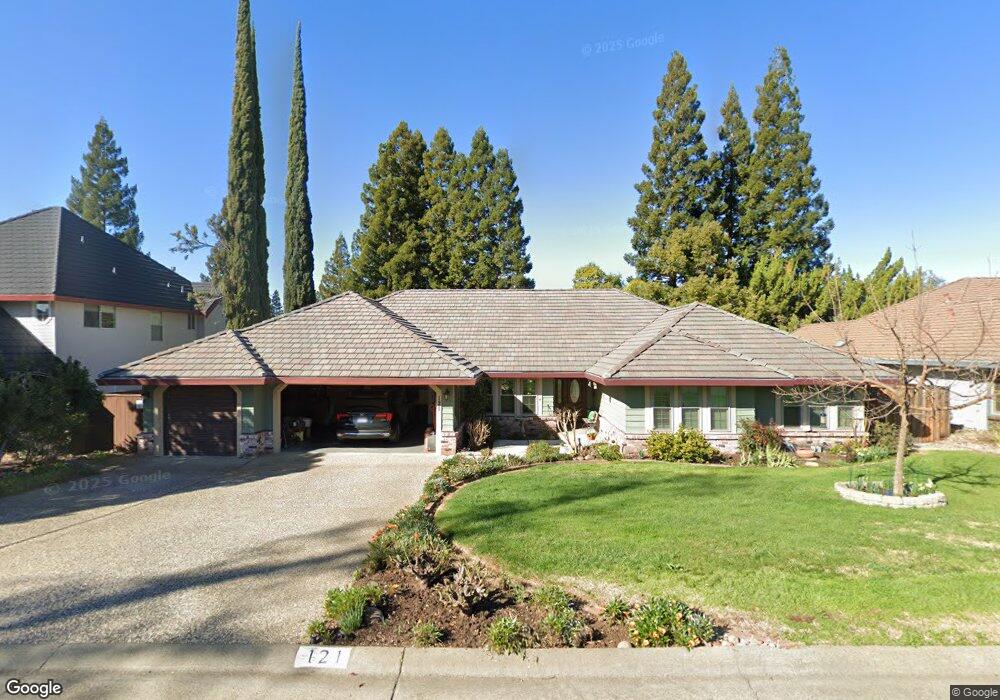
121 Cohn Valley Way Folsom, CA 95630
American River Canyon NeighborhoodEstimated Value: $819,000 - $946,000
4
Beds
3
Baths
2,557
Sq Ft
$345/Sq Ft
Est. Value
About This Home
This home is located at 121 Cohn Valley Way, Folsom, CA 95630 and is currently estimated at $881,417, approximately $344 per square foot. 121 Cohn Valley Way is a home located in Sacramento County with nearby schools including Carl H. Sundahl Elementary School, Sutter Middle School, and Folsom High School.
Ownership History
Date
Name
Owned For
Owner Type
Purchase Details
Closed on
Sep 29, 2021
Sold by
Iniguez John M and Iniguez Linda A
Bought by
Iniguez John and Iniguez Linda
Current Estimated Value
Purchase Details
Closed on
Jul 23, 2016
Sold by
Iniguez John M and Iniguez Linda A
Bought by
Iniguez John M and Iniguez Linda A
Home Financials for this Owner
Home Financials are based on the most recent Mortgage that was taken out on this home.
Original Mortgage
$440,577
Outstanding Balance
$353,628
Interest Rate
3.75%
Mortgage Type
FHA
Estimated Equity
$527,789
Purchase Details
Closed on
Oct 2, 2006
Sold by
Schieder Alajos and Schieder Gail Lee
Bought by
Iniguez John M and Iniguez Linda A
Home Financials for this Owner
Home Financials are based on the most recent Mortgage that was taken out on this home.
Original Mortgage
$517,600
Interest Rate
6.44%
Mortgage Type
Purchase Money Mortgage
Create a Home Valuation Report for This Property
The Home Valuation Report is an in-depth analysis detailing your home's value as well as a comparison with similar homes in the area
Home Values in the Area
Average Home Value in this Area
Purchase History
| Date | Buyer | Sale Price | Title Company |
|---|---|---|---|
| Iniguez John | -- | None Available | |
| Iniguez John | -- | None Available | |
| Iniguez John M | -- | Old Republic Title Company | |
| Iniguez John M | $647,000 | Stewart Title Of Sacramento |
Source: Public Records
Mortgage History
| Date | Status | Borrower | Loan Amount |
|---|---|---|---|
| Open | Iniguez John M | $440,577 | |
| Closed | Iniguez John M | $517,600 |
Source: Public Records
Tax History Compared to Growth
Tax History
| Year | Tax Paid | Tax Assessment Tax Assessment Total Assessment is a certain percentage of the fair market value that is determined by local assessors to be the total taxable value of land and additions on the property. | Land | Improvement |
|---|---|---|---|---|
| 2025 | $9,183 | $866,826 | $348,337 | $518,489 |
| 2024 | $9,183 | $849,830 | $341,507 | $508,323 |
| 2023 | $9,019 | $833,167 | $334,811 | $498,356 |
| 2022 | $8,886 | $816,832 | $328,247 | $488,585 |
| 2021 | $7,832 | $716,137 | $339,223 | $376,914 |
| 2020 | $6,907 | $633,751 | $300,198 | $333,553 |
| 2019 | $6,691 | $612,321 | $290,047 | $322,274 |
| 2018 | $6,335 | $583,164 | $276,236 | $306,928 |
| 2017 | $5,627 | $545,014 | $258,165 | $286,849 |
| 2016 | $5,600 | $509,360 | $241,276 | $268,084 |
| 2015 | $5,280 | $489,771 | $231,997 | $257,774 |
| 2014 | $5,010 | $480,168 | $227,448 | $252,720 |
Source: Public Records
Map
Nearby Homes
- 134 Gold Creek Cir
- 203 Crow Canyon Dr
- 116 Pheasant Ln
- 103 S Fork Way
- 119 Del Norte Vista Way
- 408 Sutter St
- 900 Figueroa St Unit B
- 1122 River Rock Dr
- 293 Leidesdorff St
- 603 Figueroa St
- 408 Figueroa St
- 224 Oak Canyon Way
- 106 Oak Rim Way
- 116 Raeanne Ln
- 7230 Pine Grove Way
- 709- Persifer St
- 621 Landrise Ct
- 6013 Keats Cir
- 6480 Main St Unit 32
- 6412 Benning St Unit 4A
- 111 Cohn Valley Way
- 131 Cohn Valley Way
- 150 Water View Way
- 220 Fall River Dr
- 160 Water View Way
- 120 Cohn Valley Way
- 230 Fall River Dr
- 130 Cohn Valley Way
- 141 Cohn Valley Way
- 210 Fall River Dr
- 110 Cohn Valley Way
- 180 Water View Way
- 150 Cohn Valley Way
- 151 Cohn Valley Way
- 280 Water View Way
- 100 Cohn Valley Way
- 151 Water View Way
- 290 Water View Way
- 270 Water View Way
- 141 Water View Way