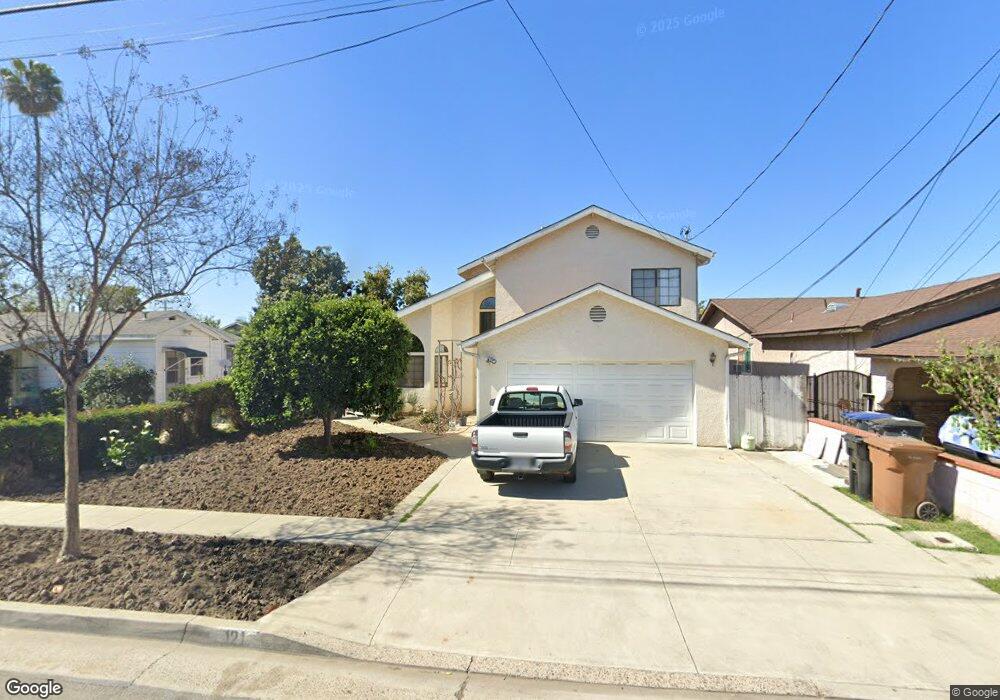
121 Kellog Ave Fullerton, CA 92833
Estimated Value: $1,189,000 - $2,267,000
5
Beds
4
Baths
2,606
Sq Ft
$578/Sq Ft
Est. Value
About This Home
This home is located at 121 Kellog Ave, Fullerton, CA 92833 and is currently estimated at $1,506,553, approximately $578 per square foot. 121 Kellog Ave is a home located in Orange County with nearby schools including Valencia Park Elementary School, D. Russell Parks Junior High School, and Buena Park High School.
Ownership History
Date
Name
Owned For
Owner Type
Purchase Details
Closed on
Feb 8, 2006
Sold by
Cabuta Pavel and Cabuta Maria
Bought by
Cabuta Maria
Current Estimated Value
Purchase Details
Closed on
Dec 24, 2001
Sold by
Cabuta Pavel
Bought by
Cabuta Pavel and Cabuta Maria
Purchase Details
Closed on
Dec 14, 2000
Sold by
Cabuta Maria
Bought by
Cabuta Pavel
Purchase Details
Closed on
Jun 17, 1996
Sold by
Cabuta Maria
Bought by
Cabuta Pavel and Cabuta Maria
Purchase Details
Closed on
Oct 27, 1995
Sold by
Cabuta Pavel and Cabuta Maria
Bought by
Cabuta Maria
Purchase Details
Closed on
Aug 16, 1995
Sold by
Cabuta Maria
Bought by
Cabuta Pavel and Cabuta Maria
Home Financials for this Owner
Home Financials are based on the most recent Mortgage that was taken out on this home.
Original Mortgage
$135,000
Interest Rate
7.5%
Purchase Details
Closed on
Jun 16, 1995
Sold by
Cabuta Pavel
Bought by
Cabuta Maria
Create a Home Valuation Report for This Property
The Home Valuation Report is an in-depth analysis detailing your home's value as well as a comparison with similar homes in the area
Purchase History
| Date | Buyer | Sale Price | Title Company |
|---|---|---|---|
| Cabuta Maria | -- | None Available | |
| Cabuta Pavel | -- | -- | |
| Cabuta Pavel | -- | -- | |
| Cabuta Pavel | -- | Southland Title Corporation | |
| Cabuta Maria | -- | -- | |
| Cabuta Maria | -- | -- | |
| Cabuta Pavel | -- | Gateway Title | |
| Cabuta Maria | -- | -- | |
| Cabuta Maria | -- | -- |
Source: Public Records
Mortgage History
| Date | Status | Borrower | Loan Amount |
|---|---|---|---|
| Previous Owner | Cabuta Pavel | $135,000 |
Source: Public Records
Tax History
| Year | Tax Paid | Tax Assessment Tax Assessment Total Assessment is a certain percentage of the fair market value that is determined by local assessors to be the total taxable value of land and additions on the property. | Land | Improvement |
|---|---|---|---|---|
| 2025 | $3,906 | $335,973 | $124,751 | $211,222 |
| 2024 | $3,906 | $329,386 | $122,305 | $207,081 |
| 2023 | $3,810 | $322,928 | $119,907 | $203,021 |
| 2022 | $3,781 | $316,597 | $117,556 | $199,041 |
| 2021 | $3,717 | $310,390 | $115,251 | $195,139 |
| 2020 | $3,696 | $307,208 | $114,069 | $193,139 |
| 2019 | $3,604 | $301,185 | $111,833 | $189,352 |
| 2018 | $3,550 | $295,280 | $109,640 | $185,640 |
| 2017 | $3,492 | $289,491 | $107,491 | $182,000 |
| 2016 | $3,421 | $283,815 | $105,383 | $178,432 |
| 2015 | $3,327 | $279,552 | $103,800 | $175,752 |
| 2014 | $3,233 | $274,076 | $101,766 | $172,310 |
Source: Public Records
Map
Nearby Homes
- 3515 W Commonwealth Ave
- 134 S Pritchard Ave
- 4200 W West Ave
- 6470 Brahms Cir
- 6 Tidewater Cove
- 2321 Williamson Ave
- 4231 W Hill Ave
- 401 S Gilbert St
- 11 Travis Rd
- 6982 Crimson Dr
- 6970 Crimson Dr
- 9 Coveside Ct
- 11 Sutherland Ct
- 8152 Whitaker St
- 6331 Los Robles Ave
- 6361 Los Robles Ave
- 6918 Crimson Dr
- 313 Napa Ct
- 605 Juniper Ave
- 2709 Baycrest Place
Your Personal Tour Guide
Ask me questions while you tour the home.