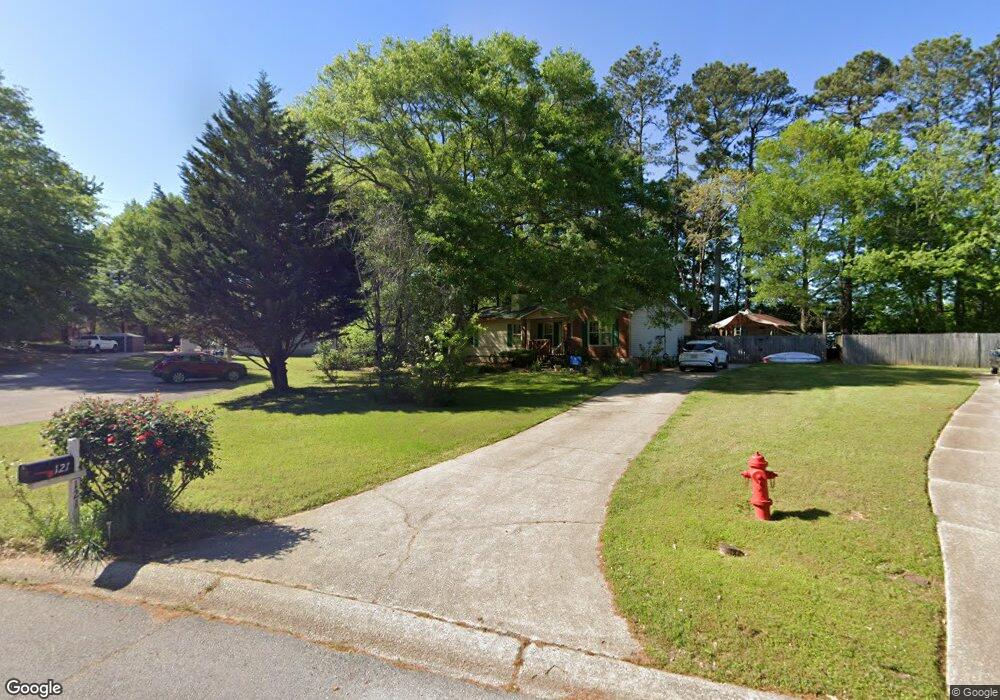
121 Pine Haven Dr Carrollton, GA 30116
Abilene NeighborhoodEstimated Value: $223,000 - $242,000
3
Beds
2
Baths
1,178
Sq Ft
$194/Sq Ft
Est. Value
About This Home
This home is located at 121 Pine Haven Dr, Carrollton, GA 30116 and is currently estimated at $228,892, approximately $194 per square foot. 121 Pine Haven Dr is a home located in Carroll County with nearby schools including Sand Hill Elementary School, Bay Springs Middle School, and Villa Rica High School.
Ownership History
Date
Name
Owned For
Owner Type
Purchase Details
Closed on
Jun 14, 2006
Sold by
Dyer Ronald James
Bought by
Chavez Arclia
Current Estimated Value
Home Financials for this Owner
Home Financials are based on the most recent Mortgage that was taken out on this home.
Original Mortgage
$93,100
Outstanding Balance
$54,735
Interest Rate
6.57%
Mortgage Type
New Conventional
Estimated Equity
$174,157
Purchase Details
Closed on
Jul 29, 2004
Sold by
Williams John R and Williams Er
Bought by
Dyer Ronald J and Dyer Jacklyn A
Purchase Details
Closed on
Jun 25, 2001
Sold by
Mack Heather
Bought by
Williams John R and Williams Er
Purchase Details
Closed on
Dec 16, 1999
Sold by
Malloy Mtg Trust
Bought by
Mack Byron and Mack Heather
Purchase Details
Closed on
Dec 15, 1999
Sold by
Richards Homes Inc
Bought by
Malloy Mtg Trust
Purchase Details
Closed on
Nov 11, 1999
Sold by
Wilson Michael and Wilson Syl
Bought by
Richards Homes Inc
Create a Home Valuation Report for This Property
The Home Valuation Report is an in-depth analysis detailing your home's value as well as a comparison with similar homes in the area
Home Values in the Area
Average Home Value in this Area
Purchase History
| Date | Buyer | Sale Price | Title Company |
|---|---|---|---|
| Chavez Arclia | $98,000 | -- | |
| Dyer Ronald J | $94,500 | -- | |
| Williams John R | $89,900 | -- | |
| Mack Heather | $3,300 | -- | |
| Mack Byron | $75,500 | -- | |
| Malloy Mtg Trust | -- | -- | |
| Richards Homes Inc | -- | -- |
Source: Public Records
Mortgage History
| Date | Status | Borrower | Loan Amount |
|---|---|---|---|
| Open | Chavez Arclia | $93,100 |
Source: Public Records
Tax History Compared to Growth
Tax History
| Year | Tax Paid | Tax Assessment Tax Assessment Total Assessment is a certain percentage of the fair market value that is determined by local assessors to be the total taxable value of land and additions on the property. | Land | Improvement |
|---|---|---|---|---|
| 2024 | $1,248 | $72,760 | $7,400 | $65,360 |
| 2023 | $1,248 | $66,908 | $7,400 | $59,508 |
| 2022 | $1,049 | $55,120 | $7,400 | $47,720 |
| 2021 | $955 | $48,406 | $7,400 | $41,006 |
| 2020 | $869 | $43,588 | $7,400 | $36,188 |
| 2019 | $810 | $40,084 | $7,400 | $32,684 |
| 2018 | $734 | $35,460 | $7,400 | $28,060 |
| 2017 | $632 | $29,660 | $2,000 | $27,660 |
| 2016 | $632 | $29,660 | $2,000 | $27,660 |
| 2015 | $570 | $24,368 | $6,000 | $18,369 |
| 2014 | $572 | $24,369 | $6,000 | $18,369 |
Source: Public Records
Map
Nearby Homes
- 55 Sage Hill Dr
- 119 Muscadine Way
- 125 Muscadine Way
- 15 Pine Chase
- 184 Lake Connie Rd
- 0 Dock Hyde Rd Unit 10627769
- 27 Mimosa Cir
- 125 Sweet Bay Ln
- 136 Jennifer Ln
- 436 Laurel Trace
- 70 E Honeysuckle Ln
- 3487 Carrollton Villa Rica Hwy
- 79 Oak Wood Dr
- 22 Shell Rd
- 315 Terrace Ridge
- 10 Amberly Way
- 377 Dock Hyde Rd
- 1645 Four Notch Rd
- 0
- 509 Tree Ridge Dr
- 107 Pine Haven Dr
- 3059 Carrollton Villa Rica Hwy
- 3073 Carrollton Villa Rica Hwy
- 141 Pine Haven Dr
- 134 Pine Haven Dr
- 95 Pine Haven Dr
- 149 Pine Haven Dr
- 98 Pine Haven Dr
- 62 Pine Haven Dr
- 62 Pine Haven Dr
- 62 Pine Haven Dr Unit 66
- 163 Pine Haven Dr
- 21 Smith Rd
- 85 Pine Haven Dr Unit 52
- 56 Haven Ridge
- 180 Pine Haven Dr
- 77 Pine Haven Dr
- 44 Pine Haven Dr
- 0 Pine Haven Dr Unit 8622227
- 67 Pine Haven Dr