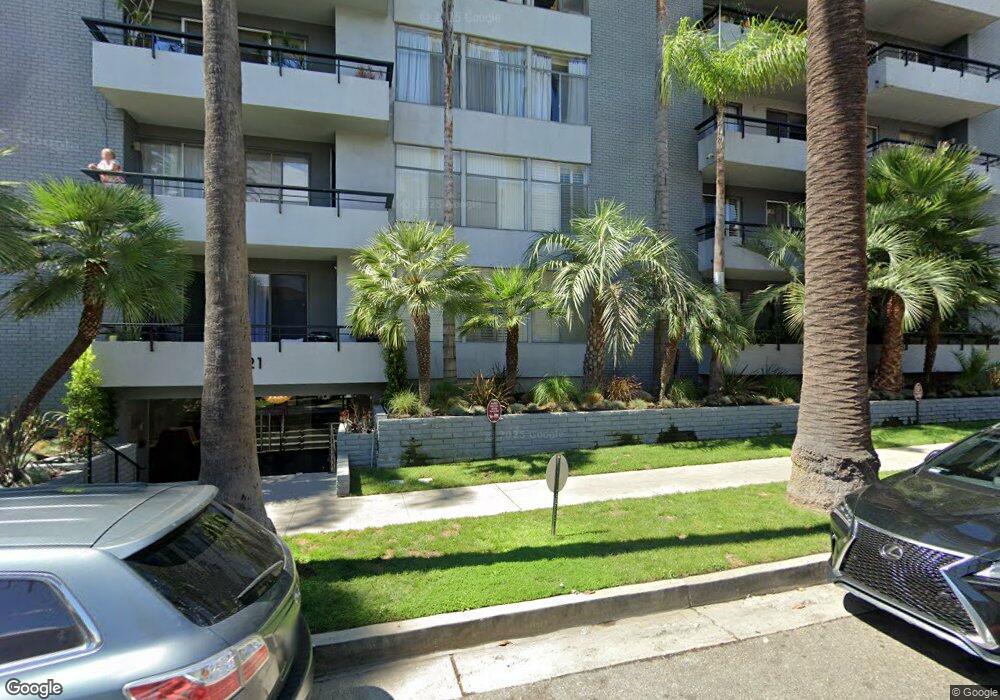
121 S Palm Dr Unit 302 Beverly Hills, CA 90212
Estimated Value: $1,019,000 - $1,593,000
2
Beds
2
Baths
1,666
Sq Ft
$840/Sq Ft
Est. Value
About This Home
This home is located at 121 S Palm Dr Unit 302, Beverly Hills, CA 90212 and is currently estimated at $1,399,234, approximately $839 per square foot. 121 S Palm Dr Unit 302 is a home located in Los Angeles County with nearby schools including Beverly Vista Elementary School, Beverly Hills High School, and Harkham Hillel Hebrew Academy.
Ownership History
Date
Name
Owned For
Owner Type
Purchase Details
Closed on
Oct 14, 2015
Sold by
Estrela Belen Lago
Bought by
Ghalchi Kamran
Current Estimated Value
Home Financials for this Owner
Home Financials are based on the most recent Mortgage that was taken out on this home.
Original Mortgage
$430,000
Outstanding Balance
$337,975
Interest Rate
3.85%
Mortgage Type
New Conventional
Estimated Equity
$1,061,259
Purchase Details
Closed on
Aug 22, 2002
Sold by
Rostami Dds Mahnaz
Bought by
Ghalchi Kamran
Home Financials for this Owner
Home Financials are based on the most recent Mortgage that was taken out on this home.
Original Mortgage
$300,700
Interest Rate
6.52%
Purchase Details
Closed on
Oct 20, 1998
Sold by
Perzigian Jerome
Bought by
Rostami Dds Mahnaz
Home Financials for this Owner
Home Financials are based on the most recent Mortgage that was taken out on this home.
Original Mortgage
$208,000
Interest Rate
5.87%
Create a Home Valuation Report for This Property
The Home Valuation Report is an in-depth analysis detailing your home's value as well as a comparison with similar homes in the area
Home Values in the Area
Average Home Value in this Area
Purchase History
| Date | Buyer | Sale Price | Title Company |
|---|---|---|---|
| Ghalchi Kamran | -- | Equity Title Company | |
| Ghalchi Kamran | $390,500 | California Title | |
| Rostami Dds Mahnaz | $260,000 | Provident Title |
Source: Public Records
Mortgage History
| Date | Status | Borrower | Loan Amount |
|---|---|---|---|
| Open | Ghalchi Kamran | $430,000 | |
| Closed | Ghalchi Kamran | $300,700 | |
| Previous Owner | Rostami Dds Mahnaz | $208,000 |
Source: Public Records
Tax History Compared to Growth
Tax History
| Year | Tax Paid | Tax Assessment Tax Assessment Total Assessment is a certain percentage of the fair market value that is determined by local assessors to be the total taxable value of land and additions on the property. | Land | Improvement |
|---|---|---|---|---|
| 2025 | $6,708 | $565,263 | $300,808 | $264,455 |
| 2024 | $6,708 | $554,180 | $294,910 | $259,270 |
| 2023 | $6,590 | $543,315 | $289,128 | $254,187 |
| 2022 | $6,402 | $532,662 | $283,459 | $249,203 |
| 2021 | $6,205 | $522,218 | $277,901 | $244,317 |
| 2019 | $6,024 | $506,730 | $269,659 | $237,071 |
| 2018 | $5,792 | $496,795 | $264,372 | $232,423 |
| 2016 | $5,543 | $477,506 | $254,107 | $223,399 |
| 2015 | $5,307 | $470,335 | $250,291 | $220,044 |
| 2014 | $5,138 | $461,123 | $245,389 | $215,734 |
Source: Public Records
Map
Nearby Homes
- 121 S Palm Dr Unit 203
- 152 S Oakhurst Dr Unit 304
- 9200 Wilshire Blvd Unit 201W
- 9200 Wilshire Blvd Unit 505W
- 9200 Wilshire Blvd Unit 201E
- 9200 Wilshire Blvd Unit 203E
- 9200 Wilshire Blvd Unit 202E
- 9200 Wilshire Blvd Unit 406W
- 9200 Wilshire Blvd Unit 304E
- 252 S Maple Dr
- 132 S Crescent Dr Unit 403
- 272 S Oakhurst Dr
- 121 N Almont Dr Unit 303
- 121 N Almont Dr Unit 103
- 149 -159 S Maple Dr
- 201 N Palm Dr
- 272 S Doheny Dr Unit 1
- 207 N Doheny Dr
- 301 S Rexford Dr Unit 1
- 301 S Rexford Dr Unit 4
- 121 S Palm Dr Unit PH
- 121 S Palm Dr Unit 601
- 121 S Palm Dr Unit 505
- 121 S Palm Dr Unit 504
- 121 S Palm Dr Unit 503
- 121 S Palm Dr Unit 502
- 121 S Palm Dr Unit 501
- 121 S Palm Dr Unit 405
- 121 S Palm Dr Unit 404
- 121 S Palm Dr Unit 403
- 121 S Palm Dr Unit 402
- 121 S Palm Dr Unit 401
- 121 S Palm Dr Unit 305
- 121 S Palm Dr Unit 303
- 121 S Palm Dr Unit 301
- 121 S Palm Dr Unit 205
- 121 S Palm Dr Unit 304
- 121 S Palm Dr Unit 204
- 121 S Palm Dr Unit 202
- 121 S Palm Dr Unit 201