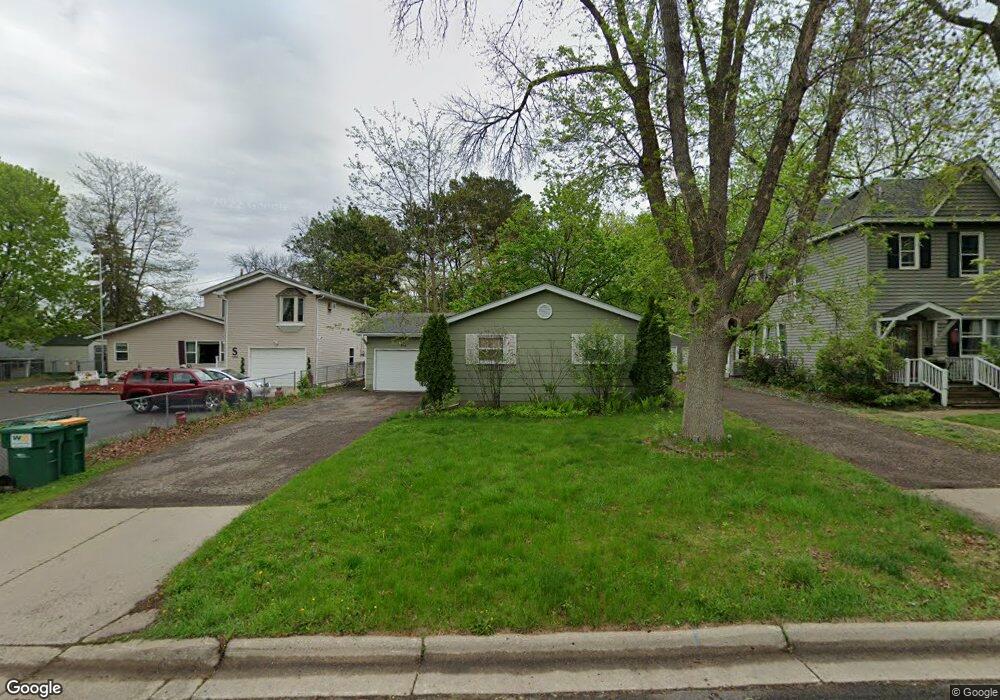
1210 1210 Bidwell St West St. Paul, MN 55118
Estimated Value: $356,000 - $376,000
4
Beds
2
Baths
1,240
Sq Ft
$294/Sq Ft
Est. Value
About This Home
This home is located at 1210 1210 Bidwell St, West St. Paul, MN 55118 and is currently estimated at $364,447, approximately $293 per square foot. 1210 1210 Bidwell St is a home located in Dakota County with nearby schools including Moreland Arts & Health Sciences Magnet School, Heritage E-STEM Magnet School, and Two Rivers High School.
Ownership History
Date
Name
Owned For
Owner Type
Purchase Details
Closed on
Jul 10, 2015
Sold by
Johnson Andrew E and Johnson Hannah
Bought by
Baxton Richard J
Current Estimated Value
Home Financials for this Owner
Home Financials are based on the most recent Mortgage that was taken out on this home.
Original Mortgage
$6,000
Outstanding Balance
$4,716
Interest Rate
4.01%
Mortgage Type
Negative Amortization
Estimated Equity
$359,731
Purchase Details
Closed on
Oct 14, 2011
Sold by
Wright Steven L
Bought by
Johnson Andrew E
Home Financials for this Owner
Home Financials are based on the most recent Mortgage that was taken out on this home.
Original Mortgage
$164,715
Interest Rate
3.75%
Mortgage Type
FHA
Purchase Details
Closed on
Apr 6, 2005
Sold by
Chubeck Lawrence S and Chubeck Jo Ellyn
Bought by
Thomas Harriet and Thomas Jessie J
Purchase Details
Closed on
Jan 26, 2001
Sold by
Burns Michael W and Burns Mary G
Bought by
Chlebeck Lawrence S and Chlebeck Jo Ellyn
Create a Home Valuation Report for This Property
The Home Valuation Report is an in-depth analysis detailing your home's value as well as a comparison with similar homes in the area
Home Values in the Area
Average Home Value in this Area
Purchase History
| Date | Buyer | Sale Price | Title Company |
|---|---|---|---|
| Baxton Richard J | $203,300 | North American Title Company | |
| Johnson Andrew E | $169,000 | Title Recording Services | |
| Thomas Harriet | $204,000 | -- | |
| Chlebeck Lawrence S | $147,000 | -- |
Source: Public Records
Mortgage History
| Date | Status | Borrower | Loan Amount |
|---|---|---|---|
| Open | Baxton Richard J | $6,000 | |
| Open | Baxton Richard J | $197,600 | |
| Previous Owner | Johnson Andrew E | $164,715 |
Source: Public Records
Tax History Compared to Growth
Tax History
| Year | Tax Paid | Tax Assessment Tax Assessment Total Assessment is a certain percentage of the fair market value that is determined by local assessors to be the total taxable value of land and additions on the property. | Land | Improvement |
|---|---|---|---|---|
| 2024 | $4,108 | $321,700 | $74,100 | $247,600 |
| 2023 | $4,108 | $337,500 | $78,500 | $259,000 |
| 2022 | $3,436 | $308,800 | $78,200 | $230,600 |
| 2021 | $3,322 | $271,800 | $68,000 | $203,800 |
| 2020 | $3,068 | $261,800 | $64,700 | $197,100 |
| 2019 | $3,000 | $237,800 | $57,000 | $180,800 |
| 2018 | $2,549 | $223,100 | $53,300 | $169,800 |
| 2017 | $2,347 | $201,100 | $50,800 | $150,300 |
| 2016 | $2,307 | $180,800 | $46,200 | $134,600 |
| 2015 | $2,153 | $156,998 | $39,910 | $117,088 |
| 2014 | -- | $141,520 | $36,243 | $105,277 |
| 2013 | -- | $126,914 | $32,023 | $94,891 |
Source: Public Records
Map
Nearby Homes
- 158 Southwind Ln
- 1220 Stryker Ave
- 1277 Hall Ave
- 100 Imperial Dr W Unit 204
- 1057 Winslow Ave
- 63 Langer Cir
- 1084 Hall Ave
- 69 Langer Cir
- 1016 Bidwell St
- 1076 Humboldt Ave
- 1062 Ohio St
- 69 Amelia Ave
- 1450 Bidwell St Unit 110
- 950 Bellows St
- 280 Edith Dr
- 1517 Timberwood Ln
- 150 Westchester Dr
- 1251 Macarthur Ave
- 908 Bellows St
- 999 Seminole Ave
- 1216 1216 Bidwell St
- 1210 Bidwell St
- 1216 Bidwell St
- 1211 Bidwell St
- 1206 Bidwell St
- 1207 Bidwell St
- 1220 Bidwell St
- 1219 Bidwell St
- 1201 Bidwell St
- 1198 Bidwell St
- 1224 Bidwell St
- 1195 Bidwell St
- 1223 Bidwell St
- 1195 Bidwell St
- 1192 Bidwell St
- 1212 Bellows St
- 1206 Bellows St
- 1230 Bidwell St
- 1188 Bidwell St
- 117 Moreland Ave W